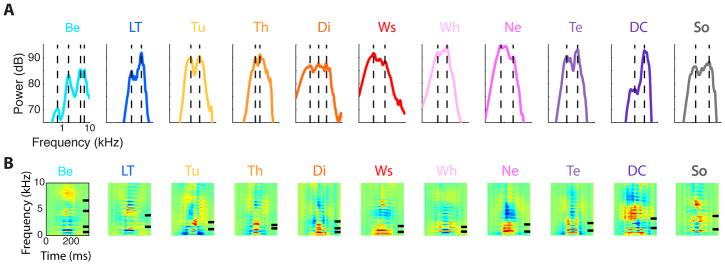
Figure 5. Formant peaks revealed by average frequency power spectra and Logistic Regression Functions (weights) for each vocalization type.
The upper panel (A) shows the average power spectrum for each vocalization type in log frequency – dB scale. Compare to Figure 4, the average power spectra were calculated on normalized spectra (peak = 100 dB), by first averaging the normalized spectra of all vocalizations within the same category for each bird and then average over birds for each vocalization type. These power spectra show two and sometimes three peaks at reliable frequencies that we call formants, using its acoustical definition. The vertical dotted lines show the location of these spectral envelope peaks. (B) For each vocalization type, we performed a separate logistic regression to assess how well a particular category could be distinguished from all the others and to determine the spectro-temporal features that could best select one vocalization type over the others. The logistic regression was applied to the vocalizations in the spectrogram feature space and the weights of the regression are shown as spectrograms. On the right side of the spectrogram, short black lines indicate the formants found in the average power spectrum of each vocalization category as shown on A. Abbreviations are defined in Figure 3.

