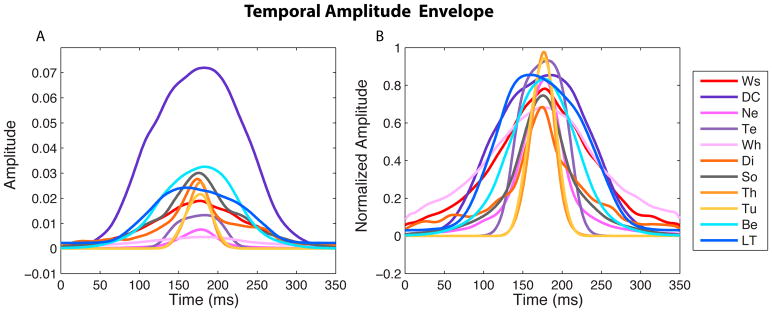
Figure 6. Temporal Amplitude Envelopes.
The average temporal amplitude envelope for each vocalization type is shown raw on the left panel (A) and normalized by peak amplitude on the right (B). Note that the y-scale is linear and not logarithmic as in the frequency power spectra of Figure 4. These average envelopes were obtained by first averaging for each bird and vocalization type, and then across birds. Abbreviations are defined in Figure 3.

