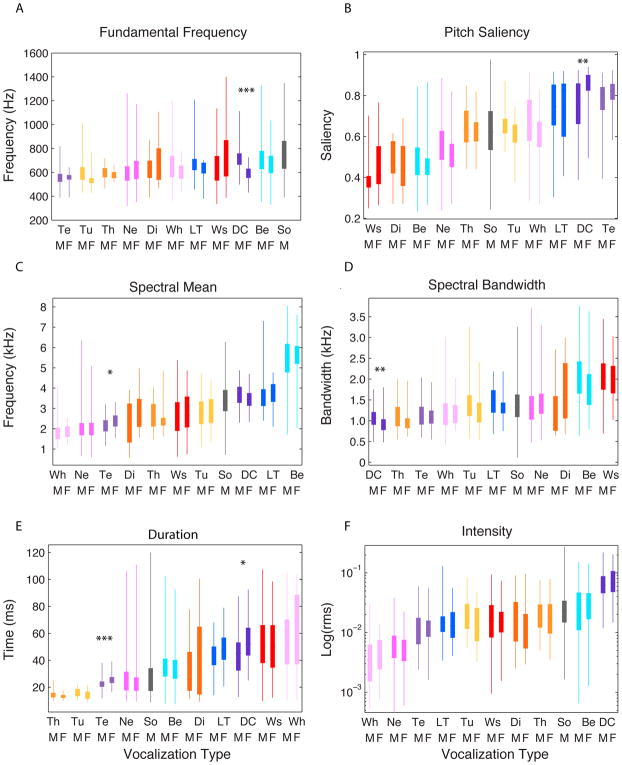
Figure 7. Box and whisker plots for 6 out of the 22 PAFs vs vocalization type.
These parameters were chosen to illustrate the distinctive acoustical properties of vocalization categories. The bottom and the top of the solid rectangles correspond to the beginning and end of the 2nd and 3rd quartile and the whiskers show the entire range of values found in our data set. In all plots the vocalization types (shown in the x-axis) are ordered in increasing value of the corresponding acoustical feature to facilitate the interpretation of the results. Two acoustical properties related to the fundamental frequency are shown on the first row: the fundamental frequency F0 (A) and the saliency (B) defined as the proportion of sections of the vocalization with an auto-correlation peak amplitude at the periodicity period greater than 50% of the peak amplitude at zero. Two acoustical properties related to the spectral envelope are shown in the middle row: the spectral mean (C) and the spectral bandwidth (D). Finally, two additional properties, the duration (E) and the sound intensity (F) are shown in the third row. The *, **, *** indicate significant differences between male and female vocalizations for specific types in post-hoc tests with p < 0.05, <0.01 and < 0.001 correspondingly. Vocalization abbreviations are defined in Figure 3.

