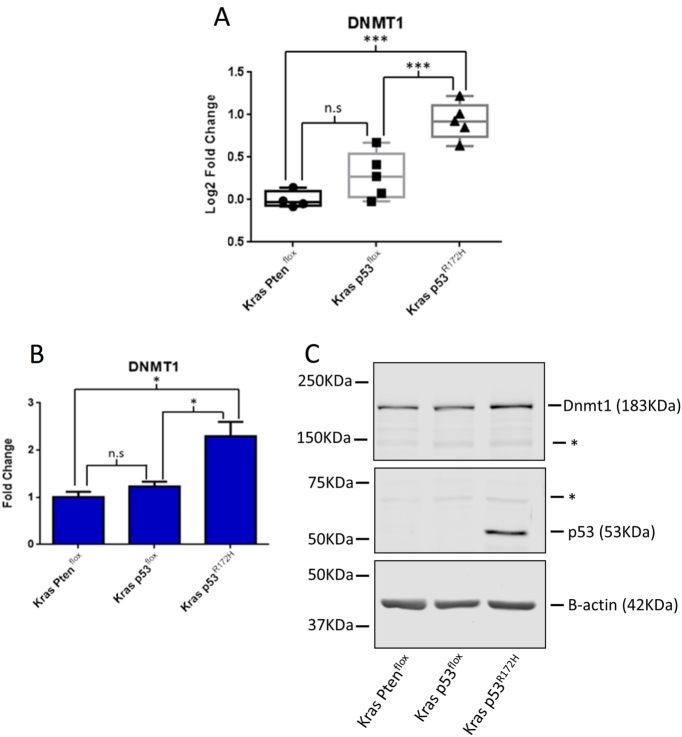
Fig. 3. Protein and mRNA expression of Dnmt1 in PDAC mouse models.
a RT-qPCR of Dnmt1 mRNA abundance in primary mouse tissues. The ΔΔCT method was used to calculate fold change using β-actin as the reference gene with the fold change being relative to the Kras Ptenflox samples. The * represent non-specific bands of unknown origin. b RT-qPCR of Dnmt1 expression in primary cell lines. The ΔΔCT method was used to calculate fold change with β-actin as the reference gene with fold change normalised to the Kras Ptenflox cell line. The result represents the mean of three biological repeats with the error bars representing the maximum relative quantity. A two-sample, two-tailed, paired t-test was used to compare the ΔCT values from each group. Statistical significance is represented as *p < 0.05 and ***p < 0.005. c A representative western blot showing the expression of Dnmt1, Pten, p53 and β-actin in the primary cell lines

