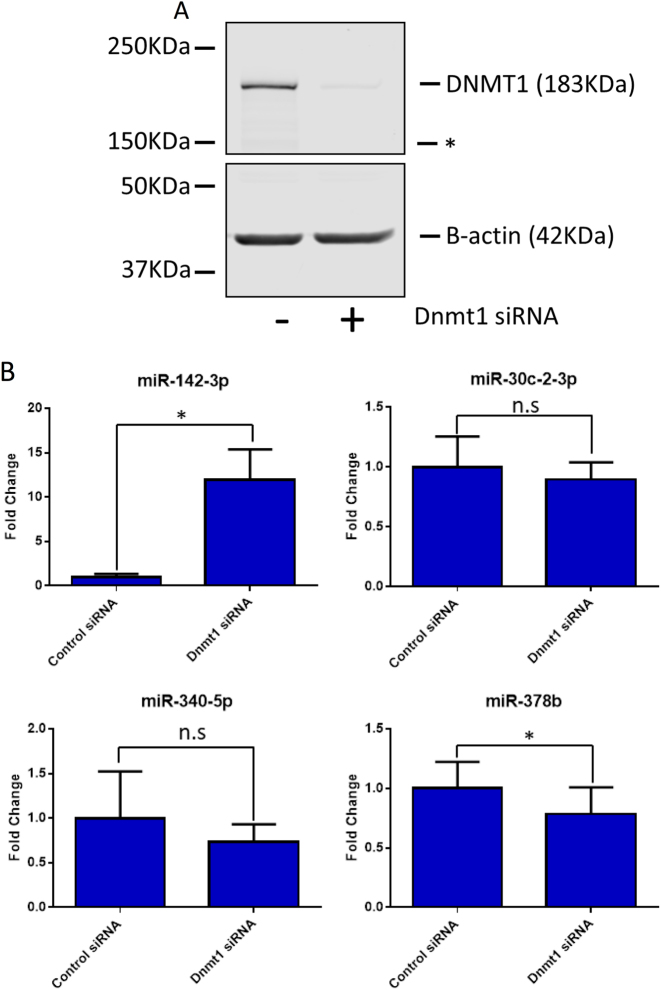
Fig. 5. Expression of microRNAs following depletion of Dnmt1.
The Kras p53R172H cell line was treated with 20 nM DNMT1 siRNA or a control siRNA for 48 h. a A representative western blot showing the expression of Dnmt1 and p53 following Dnmt1 depletion with β-actin as a loading control. The * represents a non-specific band of unknown origin. b The expression of the microRNAs dysregulated in p53R172H-expressing tissues was quantified after Dnmt1 depletion by RT-qPCR with U6 snRNA as the reference gene. The result represents the mean of three biological repeats with error bars representing the maximum relative quantity. A two-sample, two-tailed, paired t-test was used to compare the ΔCT values from each group. Statistical significance is represented as *p < 0.05

