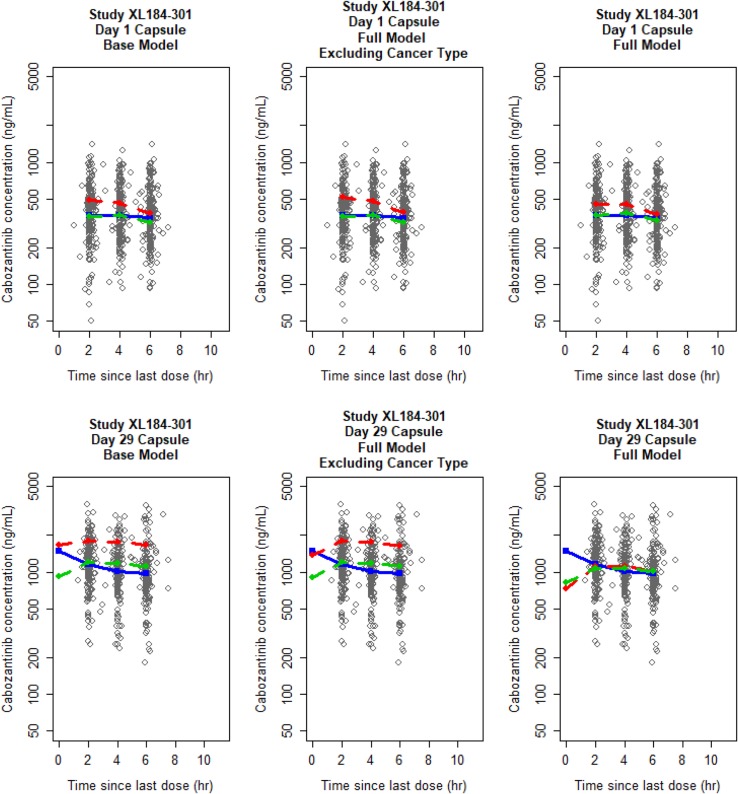
Fig. 1.
Comparison of goodness-of-fit plots for patients with medullary thyroid cancer on day 1 and day 29 of study XL184-301. Solid blue, red-dashed, and green-dashed lines correspond to geometric mean observed, typical individual predicted (PREDs), and individually predicted (IPREDs) concentrations, respectively

