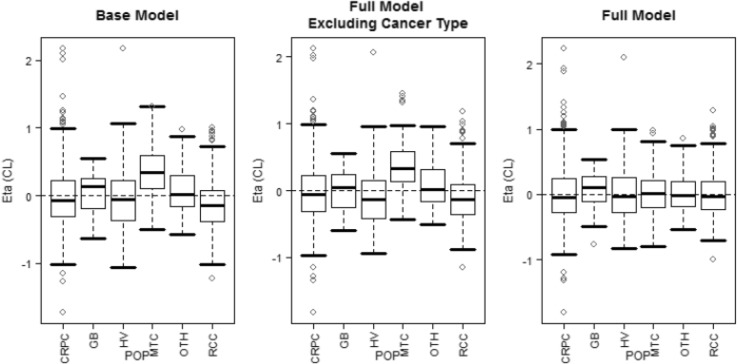
Fig. 2.
Inter-individual random effect (Eta) on CL/F versus subject population. The boxes represent median and 25th and 75th percentiles. The bars represent 5th and 95th percentiles The open circles represent individual values outside the 5th and 9th percentiles. CL clearance, CRPC castrate-resistant prostate cancer, GB glioblastoma multiforme, HV healthy volunteer, MTC medullary thyroid cancer, OTH other cancer types in Study XL184-001, POP population, RCC renal cell carcinoma

