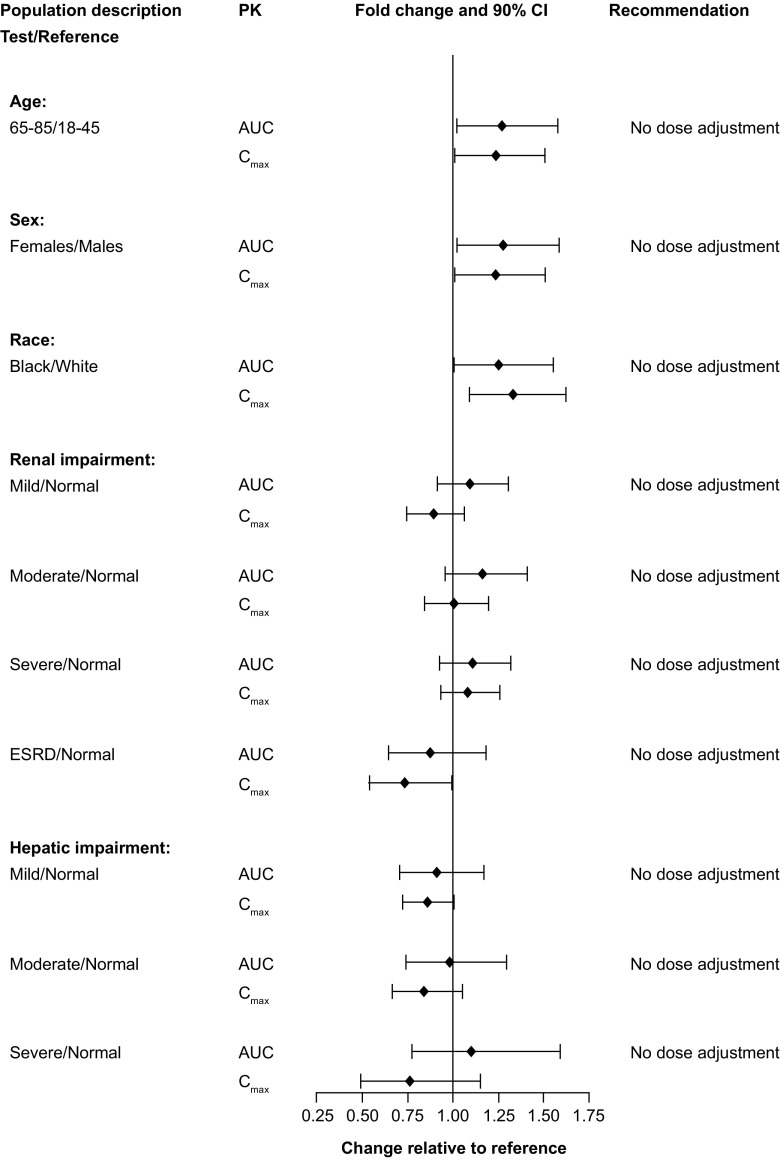
Fig. 2.
Impact of intrinsic factors on vortioxetine pharmacokinetics following multiple doses. Forest plot illustrating the fold change in area under the curve (AUC) and maximal observed plasma concentration (C max) between test and reference populations. CI confidence interval, ESRD early-stage renal disease

