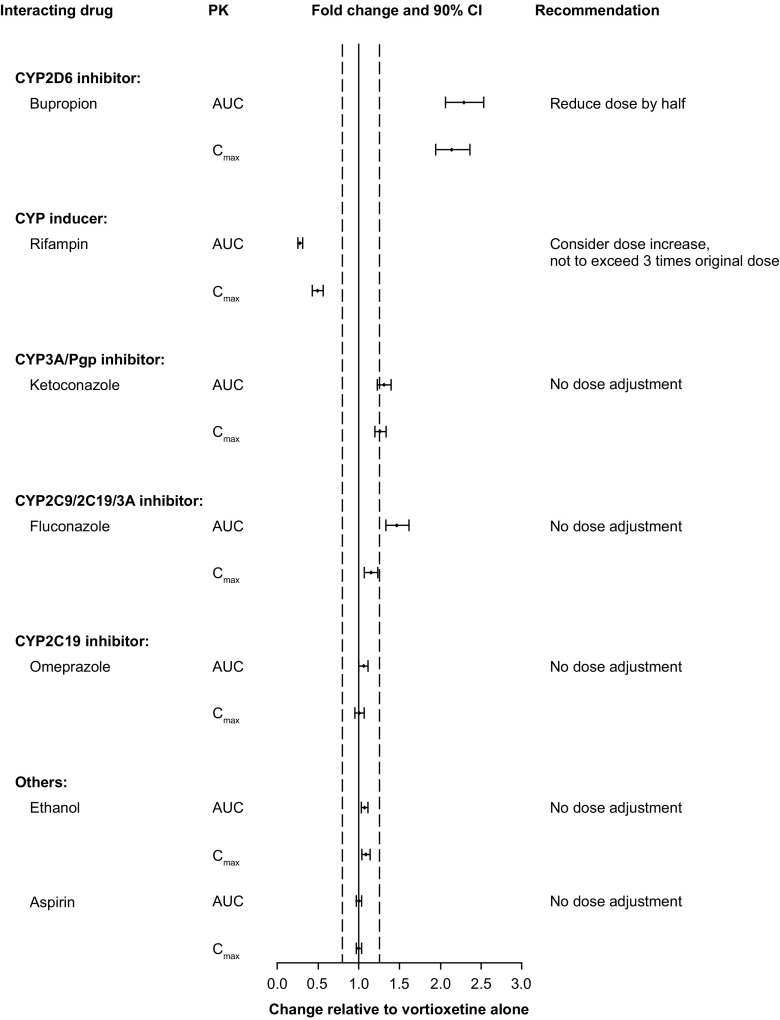
Fig. 3.
Impact of other drugs on vortioxetine pharmacokinetics. Forest plot illustrating fold change in the area under the curve (AUC) or maximal observed plasma concentration (C max) of vortioxetine when co-administered with other drugs relative to vortioxetine alone. Dashed lines indicate no effect boundaries [90% confidence interval (CI) 80–125]. Pgp P-glycoprotein

