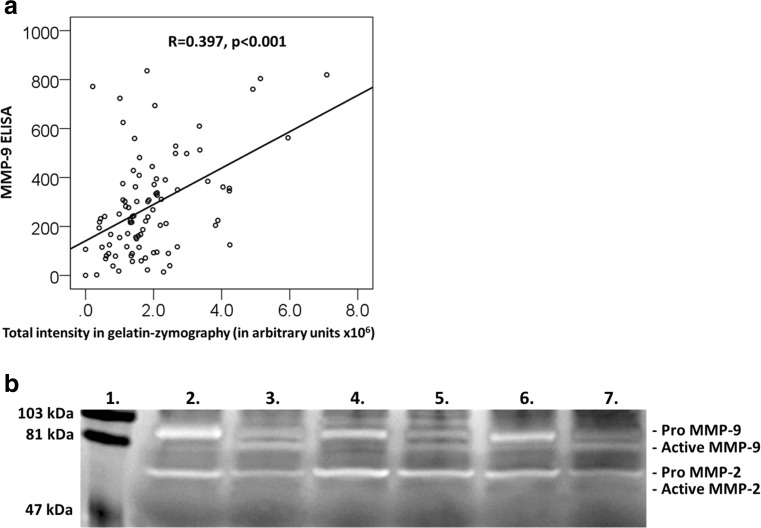
Fig. 2.
Gelatin zymography results. a Scatter plot of serum MMP-9 levels measured by ELISA and total MMP-9 intensities analyzed by gelatin zymography. The correlation coefficient and p value are shown. b Representative gelatin-zymography of ACS serum samples. Lane 1 is the molecular weight standard. Lanes 2, 4, and 6 are serum samples of patients with ACS without MMP-9 activating pretreatment. Lanes 3, 5, and 7 are the same serum samples, respectively, with 1 mM APMA pretreatment, which activates the pro-form of MMP-9. The gels are 10%, and the bands were visualized by Coomassie Brilliant Blue staining. Pro-MMP-2 bands are seen at 72 kDa. No proteolytically activated MMP-2 was observed (64 kDa)

