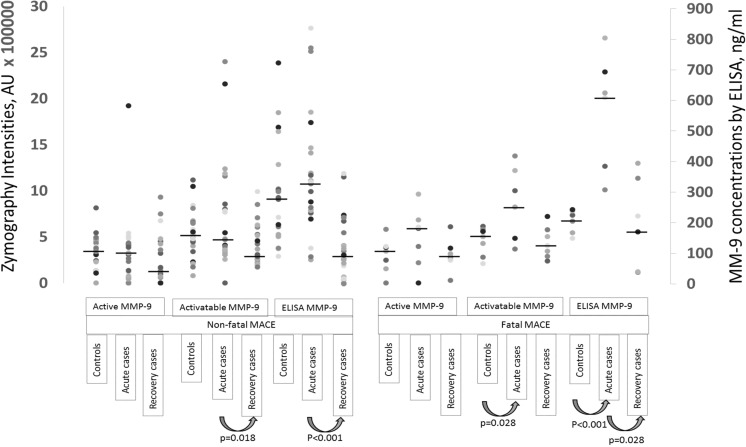
Fig. 3.
Active and APMA-activatable MMP-9 analyzed by gelatin zymography presented as arbitrary units of intensities (Y1-axis) and corresponding MMP-9 concentrations measured by ELISA (Y2-axis) in the subjects selected for zymography. All measurement points are presented as dots, and group medians are presented with a line. Statistically significant differences are presented below the plot

