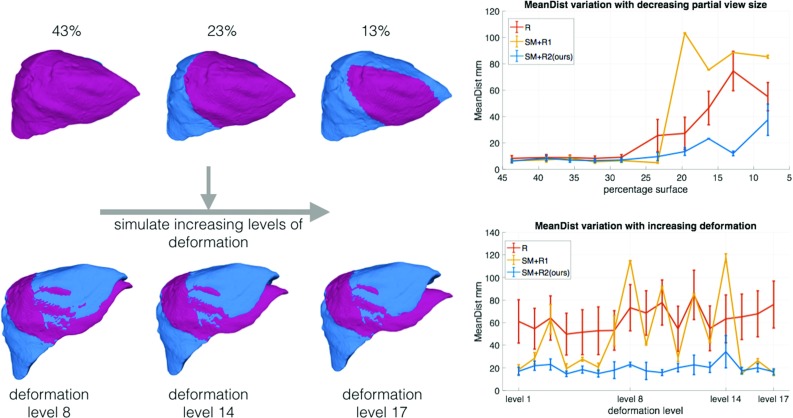
Fig. 3.

Experiments on synthetic data. Top: robustness to reduced partial size in the target model, T, bottom: robustness to increasing levels of deformation in T. The target model representing 23% of the total liver surface is used in the bottom experiment with increasing deformation levels. Color coding: moving model, M—blue, target model, T—pink
