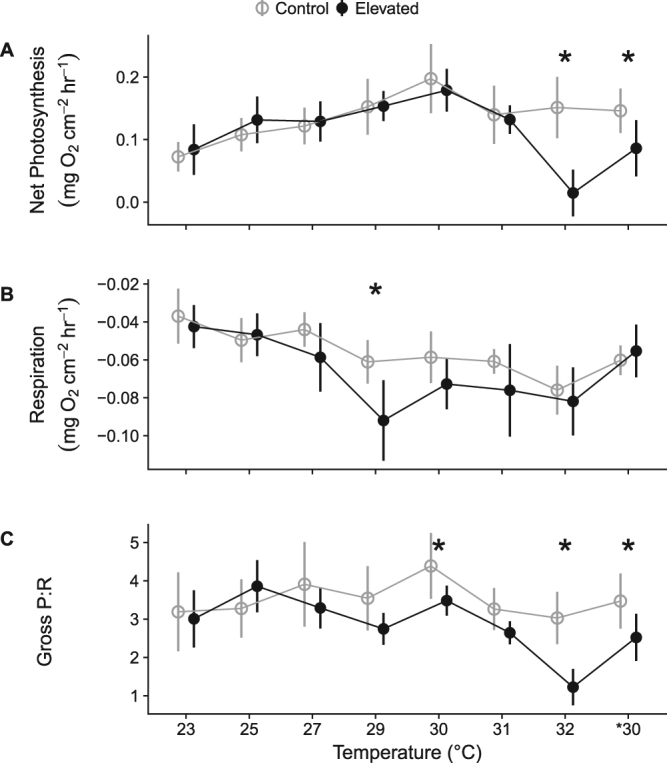
Figure 3.

Oxygen flux rates for net photosynthesis (A), respiration (B), and the ratio of gross photosynthesis to respiration (C) for C. orientalis between 23 and 32 °C. Control cores (grey open circles and lines) were all measured at 23 °C, while heated cores (black circles and lines) were sampled at the temperature indicated in the legend. *30 indicates samples that were exposed to 32 °C and then returned to 30 °C for four weeks following bleaching. Points represent means and error bars indicate one standard error. Asterisks indicate temperature increments where sponges in control and heated treatments had significantly different responses.
