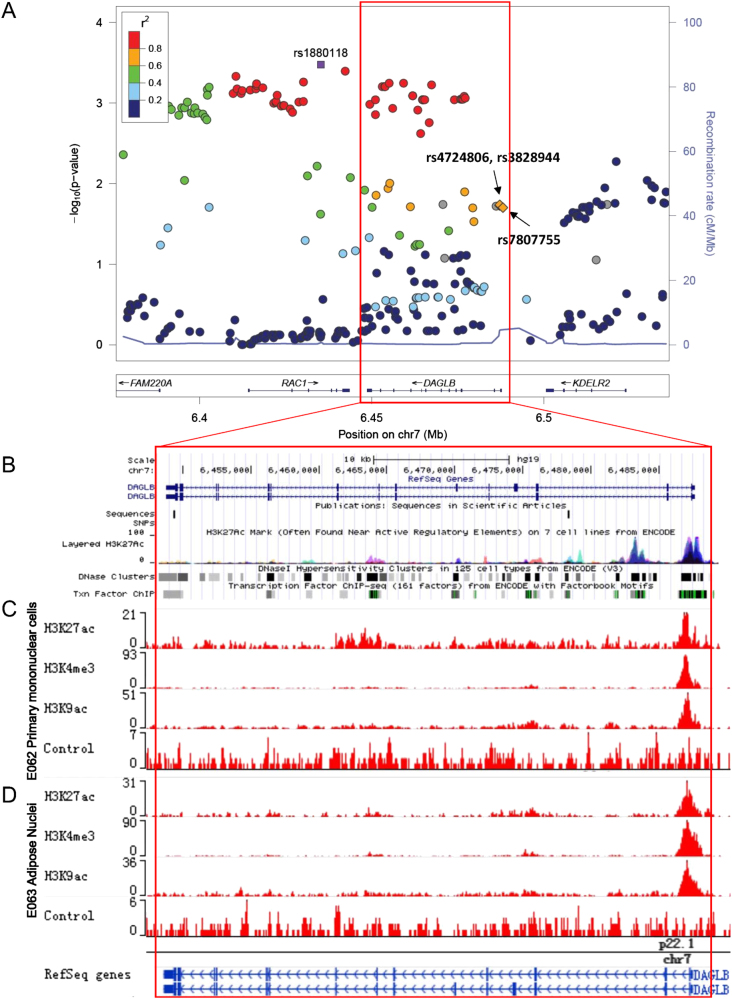
Fig. 1.
Regional plot of the replicated SNP and annotations including histone modification, transcription factor binding site, and DNase signals in this region. a Regional plot of the tagSNP rs1880118 plotted using Locuszoom. The tagSNP and another three SNPs located in a potential regulatory region are labeled. b Annotations including DNase and transcription factor binding site ChIP-seq (combined with multiple cell lines) from ENCODE project. c Histone modification signals using primary mononuclear cells from peripheral blood (E062, Roadmap project). d Histone modification signals using adipose nuclei (E063, Roadmap project)

