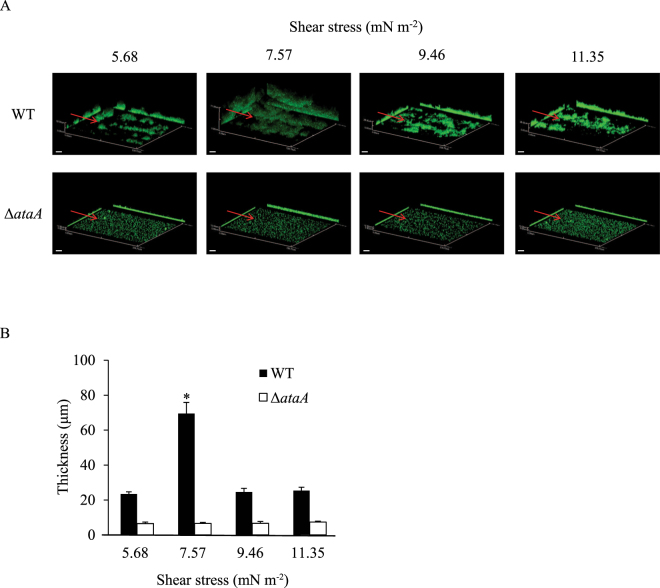
Figure 3.
Quantification of the thickness of cell clumps formed by Acinetobacter sp. Tol 5 on a rectangular observation cell at different shear stresses. (A) Confocal laser scanning microscopy 3D-images with the x-z and y-z projections after flowing 7 mL of cell suspensions of Tol 5 WT and ΔataA mutant cells (OD660 = 0.2). The red arrows indicate flow direction. Scale bar 20 µm. (B) Quantification data of the thickness of cell clumps formed by Tol 5 WT (black) and ΔataA mutant (white) cells. Data are expressed as the mean ± standard error from three independent flows (n = 3). *P < 0.01.

