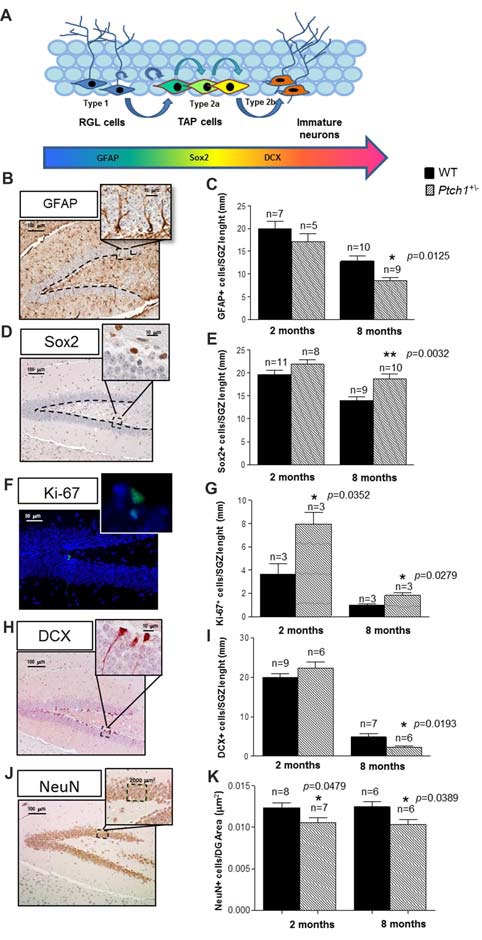
Figure 2.

Shh pathway deregulation alters the cell stage composition of DG. (A) Schematic representation of adult neurogenesis in the hippocampal DG and relative stage specific markers. (B,C) Representative immunostaining images and quantification for glial fibrillary acidic protein (GFAP). (D,E) Sex determining region Y (SRY) box 2 (Sox2), (F,G) Ki67 and (H,I) doublecortin (DCX), (J,K) NeuN. Images, 10× magnification, scale bar = 100 μm; 20× magnification, scale bar = 50 μm; 100× magnification, scale bar = 10 μm. The number of mice used per test is indicated in the graphs (n). Data are reported as mean ± SEM *p < 0.05; **p < 0.01 for comparison with controls (Student-t test).
