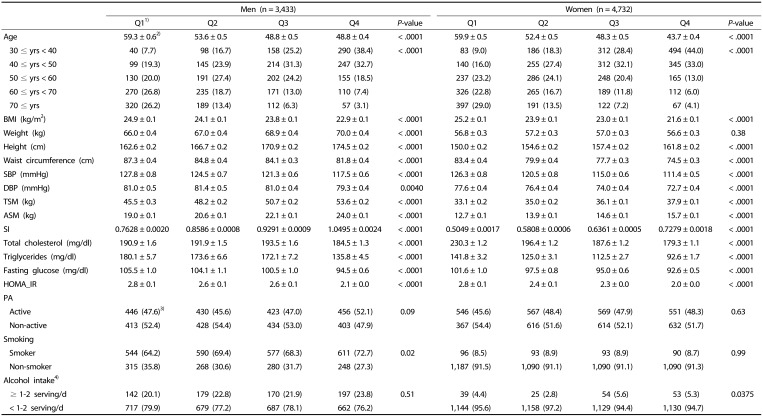
Table 1. Anthropometric and biochemical characteristics related to energy metabolism of the study subjects by quartile of the sarcopenia index (SI).
BMI, body mass index; SBP, systolic blood pressure; DBP, diastolic blood pressure; TSM, total skeletal muscle mass; ASM, appendicular skeletal muscle mass; SI, sarcopenia index; HOMA_IR, homeostatic model assessment-insulin resistance; PA, physical activity; Smoking, smoking status.
1)For men the first quartile (Q1): SI < 0.82, Q2: 0.82 ≤ SI < 0.89, Q3: 0.89 ≤ SI < 0.97, and Q4: 0.97 ≤ SI. For women, Q1: SI < 0.55, Q2: 0.55 ≤ SI < 0.61, Q3: 0.61 ≤ SI < 0.67, and Q4: 0.67 ≤ SI.
2)Mean ± SE.
3)n (%)
4)A serving size of alcohol intake: one cup (50cc) of soju or one glass of beer (200cc), “≥ 1–2 serving/d” corresponds to ≥ 2 servings/d for men and ≥ 1.5 servings/d for women, “< 1–2 servings/d” corresponds to < 2 servings/d for men and < 1.5 servings/d for women. The p values are from ANOVA for continuous variables and χ2 test for categorical variables assessing the difference between the groups.

