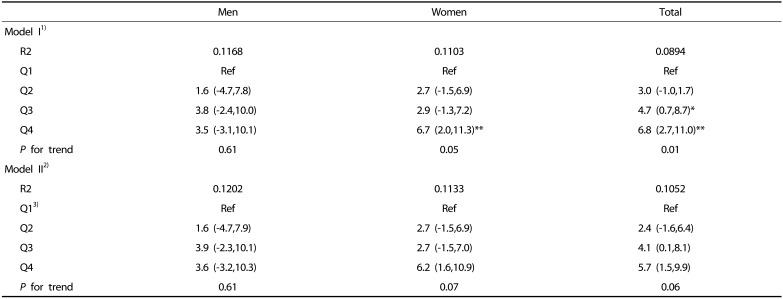
Table 4. Estimated change in carbohydrate intake according to quartile of the sarcopenia index (SI).
Beta coefficient with 95% confidence interval is shown.
1)Model I: adjusted for age, body weight and energy from alcohol intake.
2)Model II: model I + physical activity + the level of total cholesterol and fasting glucose + smoking status.
3)For men the first quartile (Q1): SI < 0.82, Q2: 0.82 ≤ SI < 0.89, Q3: 0.89 ≤ SI < 0.97, and Q4: 0.97 ≤ SI. For women, Q1: SI < 0.55, Q2: 0.55 ≤ SI < 0.61, Q3: 0.61 ≤ SI < 0.67, and Q4: 0.67 ≤ SI.
*P < 0.05, ** P < 0.01 compared to reference group of sarcopenia index (Q1) within same sex or total subjects.

