
Figure 3.
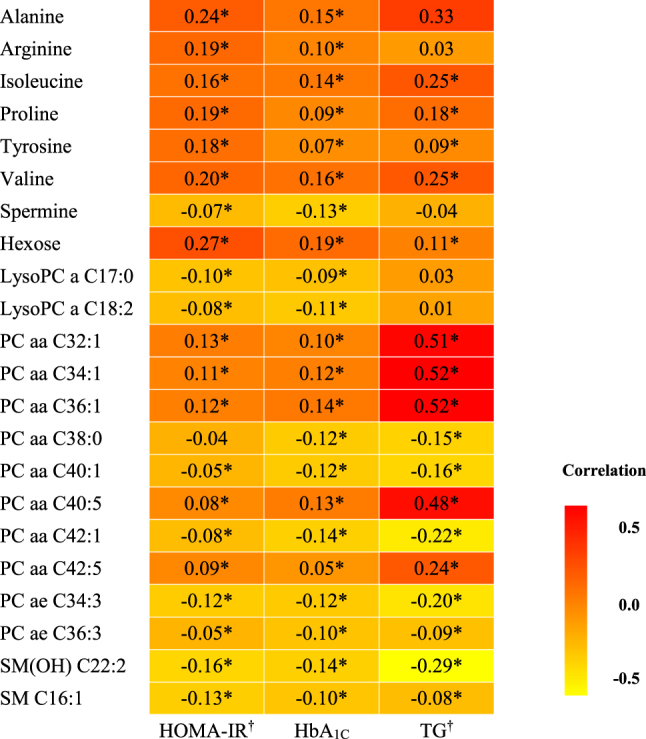
Correlation analysis plot of metabolites and biomarkers. *Correlation coefficients were obtained with partial correlation analysis adjusting for sex, age, energy intake, body mass index, metabolic equivalent, smoking status, drinking status, household income, and education level (p < 0.05). †The value of biomarkers used in these analyses were log-transformed. LysoPC a: lyso phosphatidylcholine acyl; PC aa: phosphatidylcholine diacyl; PC ae: phosphatidylcholine acyl-alkyl; SM(OH): hydroxysphingomyelin; SM: sphingomyelin.