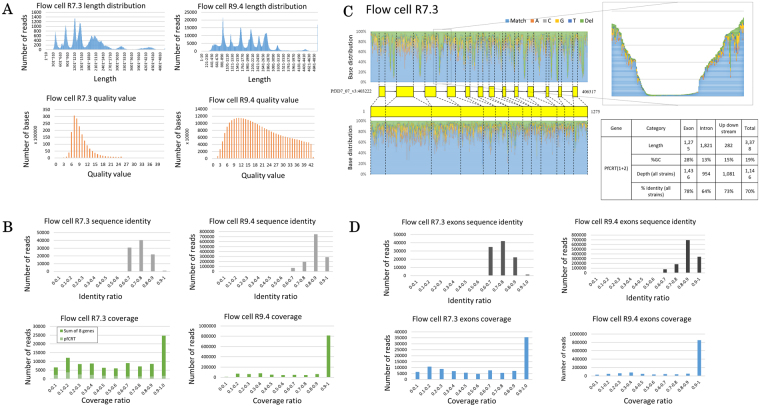
Figure 1.
Sequencing statistics of laboratory strains. Nanopore sequencing covers the whole length of nine genes of the laboratory strains regardless of the flow cell version. The quality value is significantly better for flow cell R9.4 (A). The sequence accuracy is better for flow cell R9.4. Mapped reads are fragmented with flow cell R7.3, especially PfCRT (B). The fragmentation is caused by introns (PfCRT is shown as an example) having higher AT counts than the exons (lower right panel). Upper left panel shows the SNPs distribution of PfCRT, while lower left panel shows the SNPs distribution of PfCRT protein-coding regions only. Light blue color symbolizes the matched sequenced nucleotides to the reference genome, while orange, grey, yellow, dark blue, and green colors symbolize the mutation to adenosine, cytosine, guanine, thymine, and deletion, respectively. Upper right panel shows the magnification of the deleted section of a PfCRT intron. Data for this figure is obtained with flow cell R7.3 (C). When introns are excluded from the analysis, fragmentations decrease with no difference in sequence accuracy on flow cell R7.3, but such problem is not found on flow cell R9.4, even if introns are included in the analysis (D). Note the significant increase in read number on flow cell R9.4 in Figures A, B, and D.

