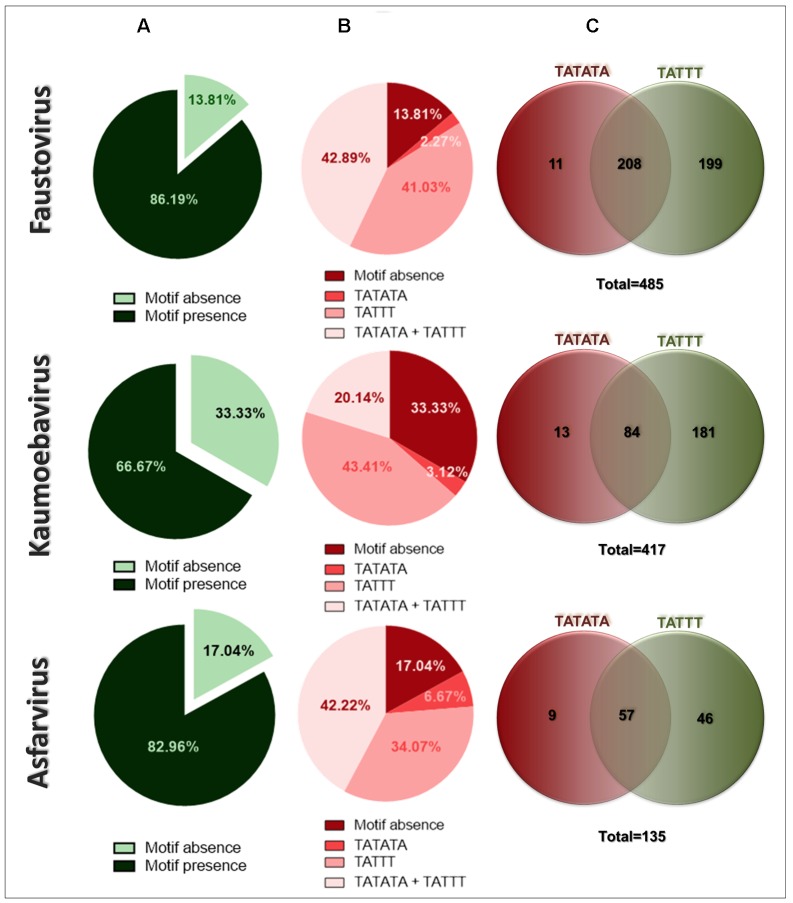
FIGURE 1.
Percentage of intergenic regions (IRs) containing the TATTT and TATATA motifs: faustovirus, kaumoebavirus, and asfarvirus. (A) The total distribution of TATTT and TATATA motifs in the IRs. (B) The differential distribution of only the TATTT or TATATA motifs of both motifs in the same IR. (C) A Venn diagram representing the absolute number of IRs containing only TATTT or TATATA motifs and of those with both motifs.

