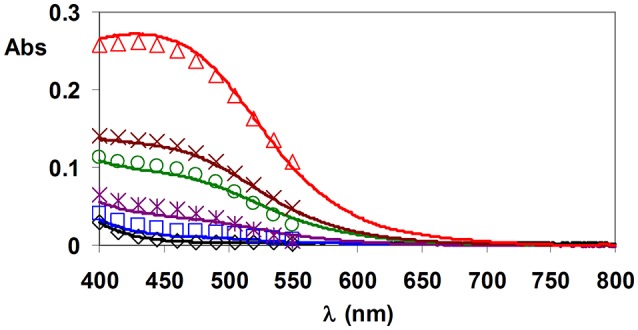
Figure 1.

Absorption spectra of FeIII–HTRAP5−-Bha− equilibrium systems. Open symbols and solid lines represent experimental and calculated absorbance values, respectively. ([Fe(TRAP)(OH)x(−3−x)] = 0.2 mM, [HBha] = 0.0 mM (black). mM (blue), mM (purple), mM (green), mM (brown), and mM (red), x = 0 and 1, pH = 10.0, 0.15 M NaNO3, 25°C).
