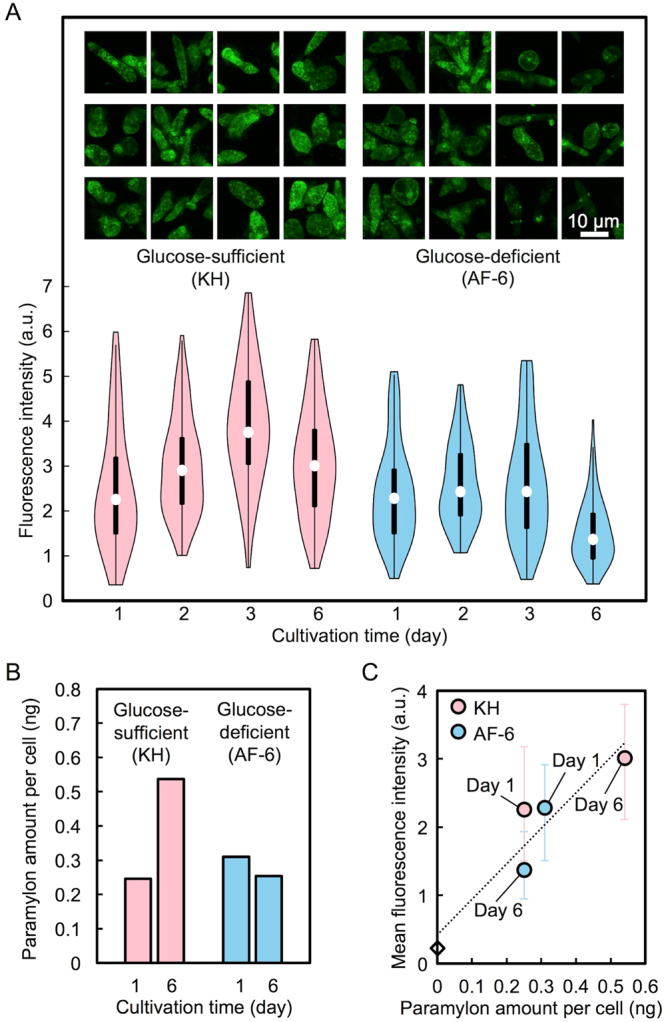
Figure 5.

Monitoring the time-varying distribution of intracellular paramylon in E. gracilis cells under glucose-sufficient and -deficient conditions. (A) Fluorescence images (top) and violin plots of the fluorescence intensity (bottom) of E. gracilis cells on Day 1, Day 2, Day 3, and Day 6. (B) Paramylon amount per cell on Day 1 and Day 6 measured by carbohydrate assay. (C) Relation between the paramylon amount per cell and the mean fluorescence intensity of E. gracilis cells. The mean fluorescence intensity at a paramylon amount of 0 ng indicates the background fluorescence intensity of the AF-6 medium without cells.
