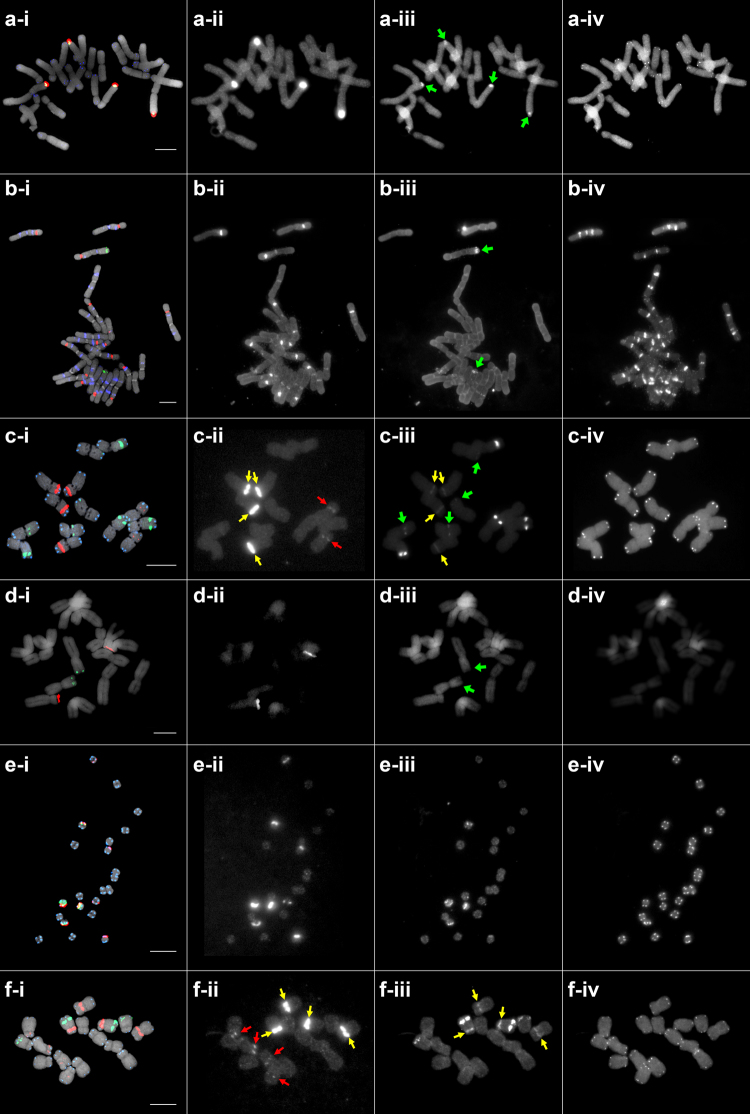
Figure 2.
PLOP-FISH signals in gymnosperm and angiosperm species. (a) Ginkgo biloba and (b) Pinus densiflora, (c) Hordeum vulgare, (d) Allium cepa, (e) Phaseolus vulgaris, (f) Trigonella foenum-graecum. Panels i–iv show the merged, raw 45S rDNA, raw 5S rDNA, and raw telomeric PLOP signals, respectively. Red, green, and blue signals in a-i – f-i represent 45S rDNA, 5S rDNA, and telomere, respectively. Red, green, and yellow arrows indicate weak 45S, weak 5S, and 45S signal crosstalk in the FITC filter, respectively. Bars = 10 μm.

