
Figure 1.
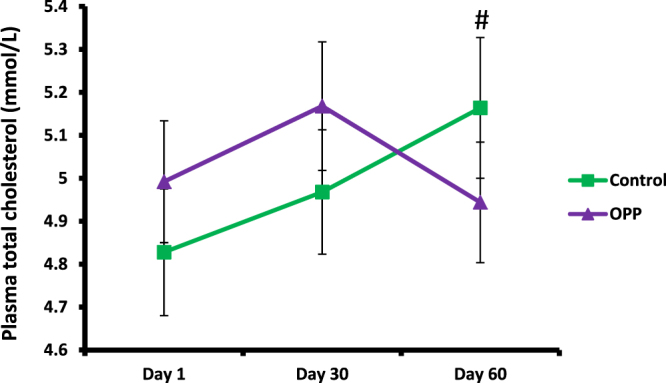
Total cholesterol level in plasma following OPP and control treatments for 60 days. #Time × treatment interaction was significant, p = 0.001 (2-factor repeated measures ANOVA). Based on Wilcoxon signed rank test, TC was significantly lower for OPP treatment compared to control treatment (at day 60), p = 0.025. However, following Bonferroni correction, no significant difference of total cholesterol level was found between OPP and control treatments at day 1, 30 and 60.