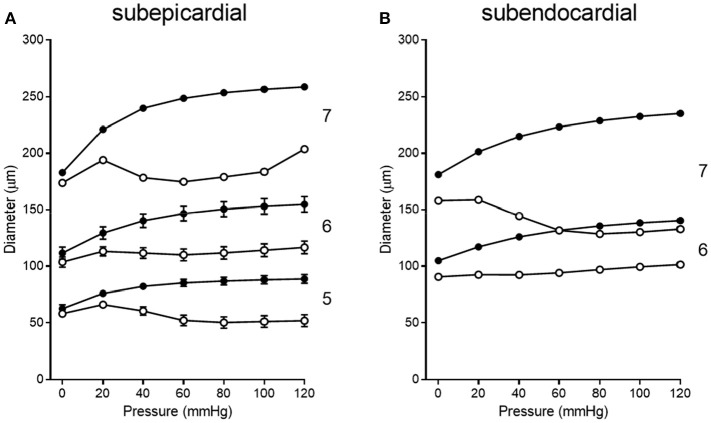
Figure 7.
Composite pressure-diameter relationships for all studies of swine coronary arterioles listed in Table 1. Filled symbols represent the passive curves, while open symbols represent the active myogenic responses. Order numbers are given to the right of each data set. In the subepicardium (A), data are available from order 7 (1 study), order 6 (9 studies), and order 5 (3 studies). For subendocardial vessels (B), data are available for orders 7 and 6 (1 study each).

