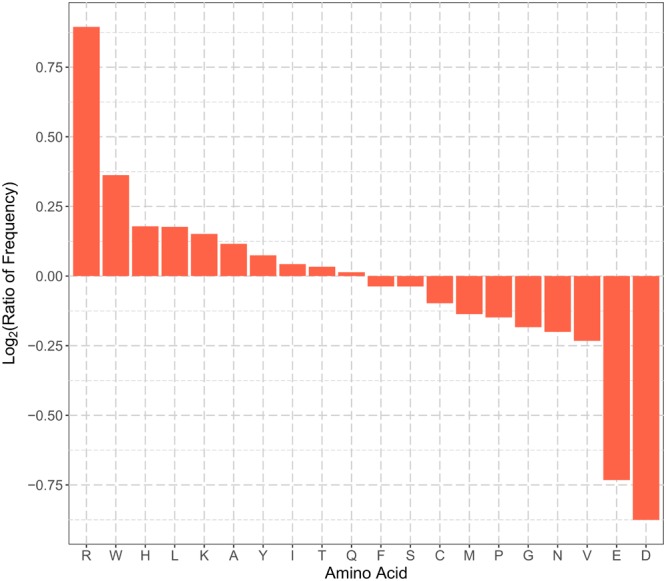
FIGURE 1.

Comparisons of N-terminal sequence amino acid frequencies in the positive and negative training datasets. The vertical axis represents the log2 ratio of average frequency of each type of amino acid for the N-terminal 22 residues between positive and negative training set. Amino acid residues in the horizontal axis are sorted in the descending order of the log2 ratio. A value greater than zero indicates that the corresponding amino acid residue is enriched in the N-terminal sequences of plant mitochondrial proteins, and vice versa.
