
FIGURE 2.
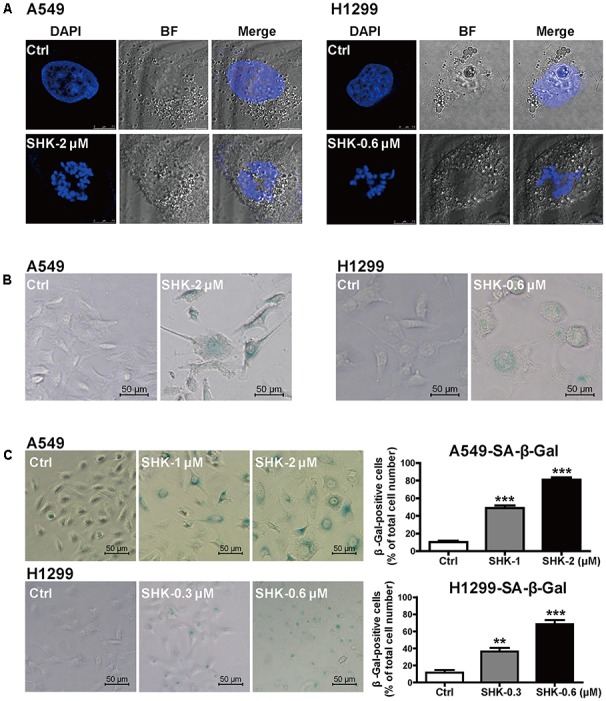
SHK induced senescence in A549 and H1299 cells. (A) Representative confocal imaging (scale bar: 7.5 μm) of SAHF in A549 and H1299 cells after SHK treatment using DAPI (blue) staining. (B) Morphologic changes of A549 and H1299 cells were observed after SHK treatment. (C) The proportions of senescence A549 and H1299 cells were determined using SA-β-Gal staining after SHK treatments. ∗∗P < 0.01, ∗∗∗P < 0.001 vs. Ctrl (control).