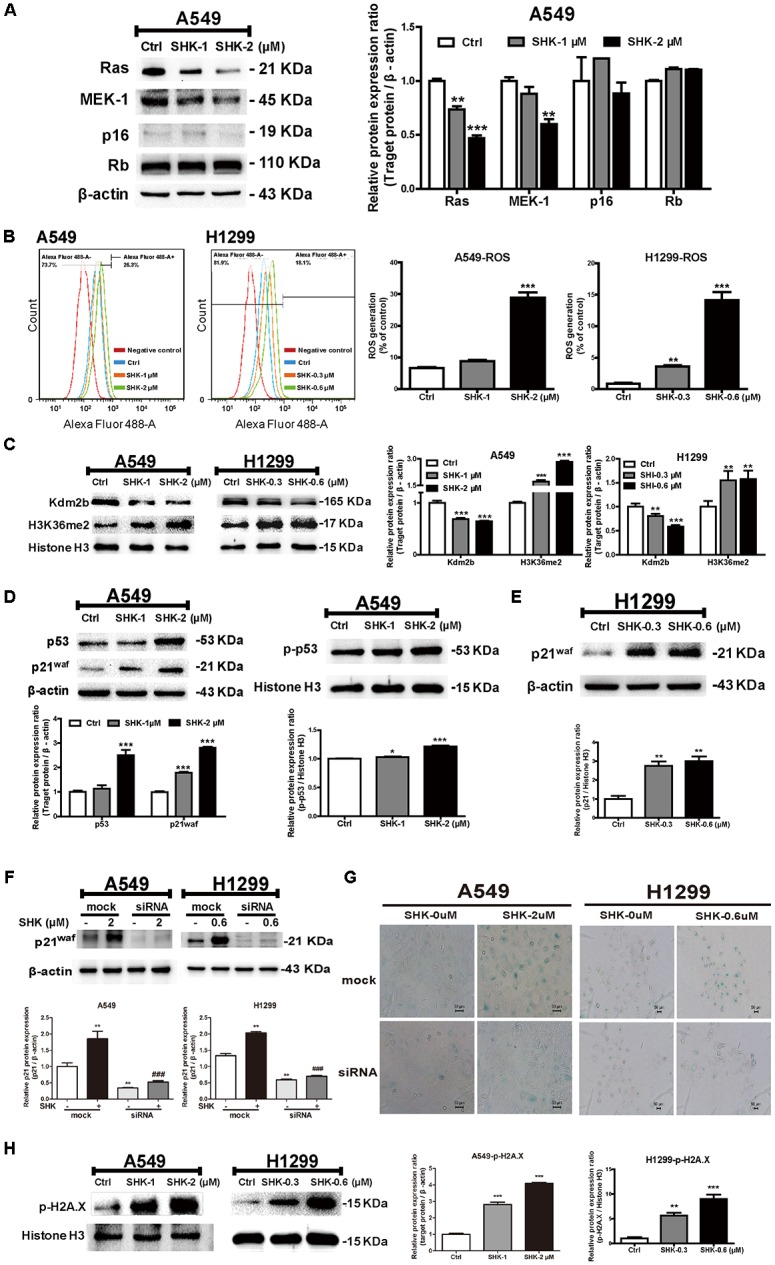
FIGURE 3.

The underlying mechanism of SHK-induced senescence in A549 and H1299 cells. (A) Expressions of Ras, MEK-1, p16 and Rb in A549 cells after SHK treatments. (B) Levels of ROS generation in A549 and H1299 cells were detected by flow cytometry after SHK treatments. (C) Expressions of Kdm2b and H3K36me2 were measured by Western blot after SHK treatments. (D) Expressions of p53 and p21waf in total protein, and p-p53 in nuclei were determined by Western blot after SHK treatments. (E) Expressions of p21waf in H1299 cells were measured by Western blot after SHK treatments. (F) Expressions of p21waf in A549 and H1299 cells transfected with siRNA after SHK treatments. (G) Representative SA-β-Gal staining imaging (scale bar: 50 μm) of A549 and H1299 cells transfected with siRNA after SHK treatments. (H) Expression of p-H2A.X was inspected by Western blot after SHK treatments. ∗P < 0.05, ∗∗P < 0.01, ∗∗∗P < 0.001 vs. Ctrl (control), ###P < 0.001 vs. SHK.
