
FIGURE 6.
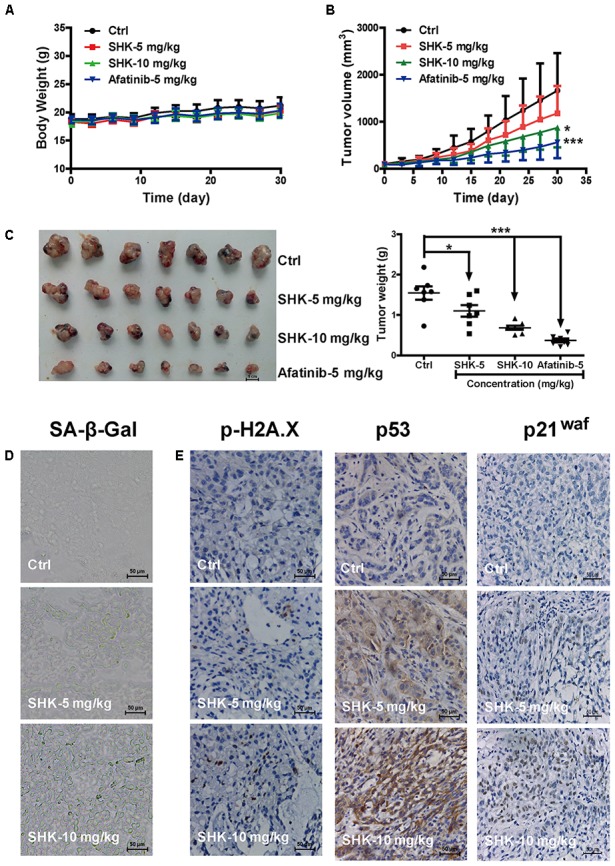
Inhibitory effects of SHK in A549 xenograft mice model. (A) Average body weight curves of Balb/c-nude mice (n = 7). (B) Tumor volume ((L × W2)/2, L, long diameter; W, wide diameter) were analyzed. (C) Tumors were photographed and tumor weights were analyzed. (D) Images of senescence cells in tumor consecutive frozen sections using SA-β-Gal staining assay (scale bar: 50 μm). (E) Images of tumor p-H2A.X, p53 and p21waf protein expressions were presented by immunohistochemistry (scale bar: 50 μm). ∗P < 0.05, ∗∗∗P < 0.001 vs. Ctrl (control).