
FIGURE 7.
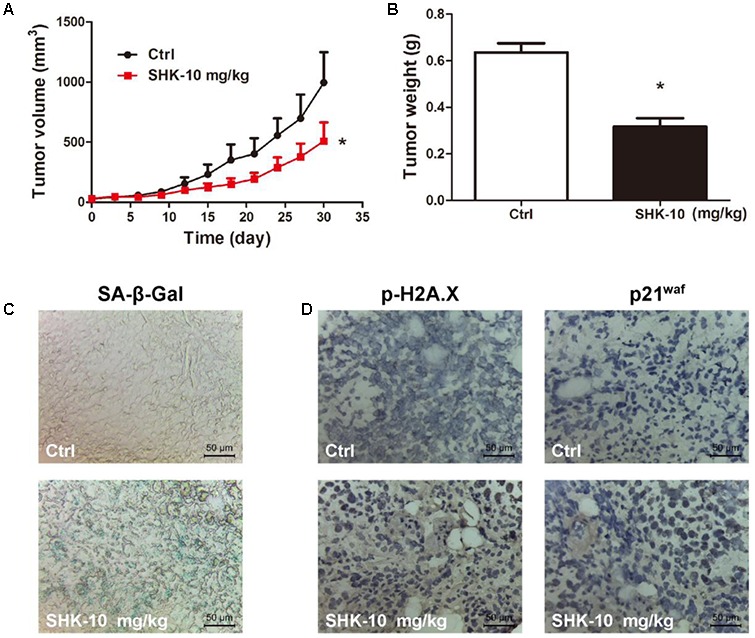
Anti-tumor effects of SHK in H1299 xenograft mice model. (A) Tumor volumes were analyzed. (B) Tumor weights were analyzed. (C) Images of senescence cells in tumor consecutive frozen sections using SA-β-Gal staining assay (scale bar: 50 μm). (D) Images of tumor p-H2A.X and p21waf protein expressions were presented by immunohistochemistry (scale bar: 50 μm). ∗P < 0.05 vs. Ctrl (control).