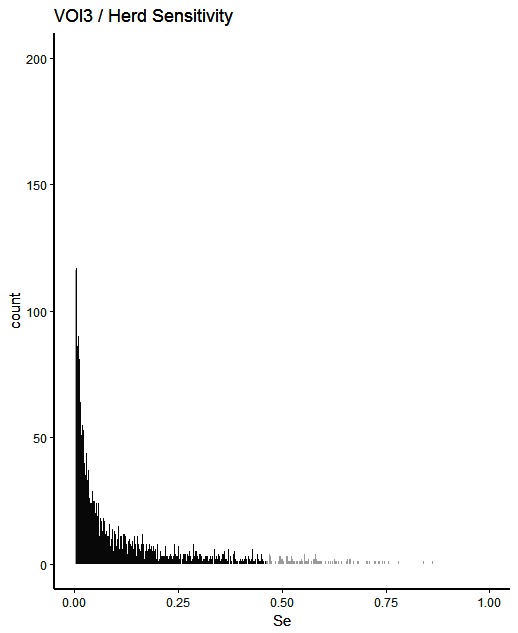
Figure 3.

Distribution of herd-level detection sensitivities for VOI3 (visual-only inspection, with a 3-fold reduction in animal-level sensitivities), based on the number of bTB-affected herds among 1,000 simulated Irish herds. The middle 90% of the distribution is highlighted in black, and the 5% tail at either end in grey.
