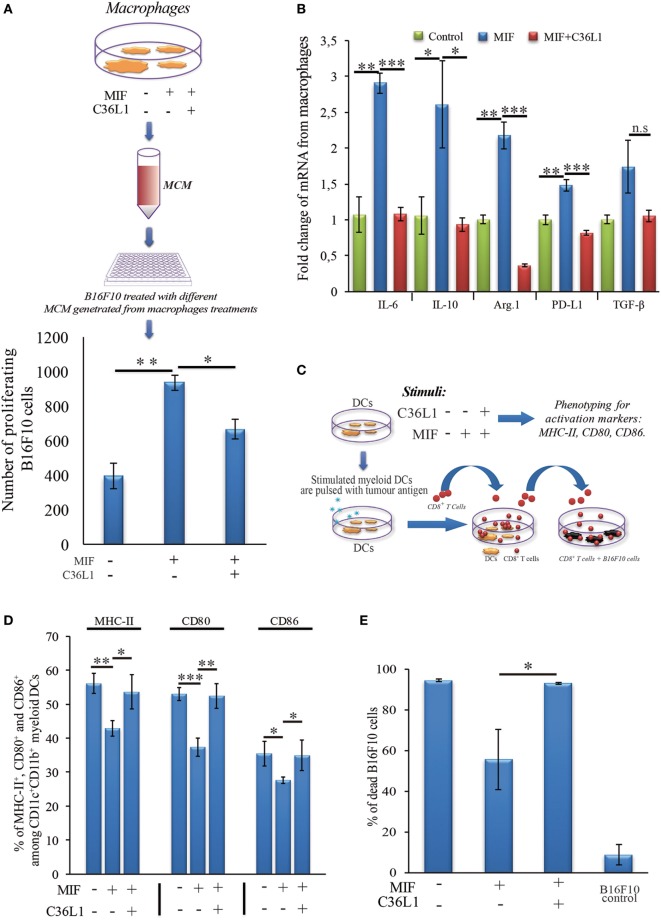
Figure 6.
C36L1 blocks macrophage migration inhibitory factor (MIF) induced immunosuppressive effect on macrophages (MOs) and dendritic cells (DCs). (A) Top: Schematics describing the workflow of the tumor cell proliferation assay. B16F10 metastatic melanoma cells are exposed to conditioned media from: untreated MOs, MOs exposed to MIF (200 ng/mL), or MOs exposed to C36L1 (200 µg/mL) + MIF (200 ng/mL). The number of live proliferating B16F10 cells was quantified by flow cytometry after 72 h. Bottom: Bar graph represents average of three independent experiments (n = 3), mean ± SEM. Data were analyzed using a two-tailed unpaired t-test (***p < 0.001). (B) C36L1 blocks MIF-induced immunosuppressive effect on primary MOs. mRNA levels of TGF-β (n.s. = 0.058), IL-10 (*p = 0.049, p = 0.042), Arg.1 (**p = 0.002, ***p < 0.001), PD-L1 (**p = 0.0049, ***p < 0.001), and IL-6 (**p = 0.0015, ***p < 0.001) from MOs exposed to recombinant MIF in the presence or absence of C36L1 peptide. Experiment was performed in triplicates (n = 3). Values represent mean ± SEM and were analyzed using a two-tailed unpaired t-test. (C) Schematics describing the different conditions in which DCs were cultured and then used to activate T cells. Primary DCs were incubated with MIF (200 ng/mL) in the presence or absence of C36L1 peptide and activation markers were quantified by flow cytometry. These DCs were further pulsed with a melanoma antigen peptide and incubated with syngeneic purified CD8+ T cells. Next, T cells were harvested and incubated with melanoma B16F10 cells at a ratio of 10/1 CD8+ T cells/B16F10 tumor cell. (D) Quantification of MHC-II (p = 0.01), CD80 (p < 0.001), and CD86 (p = 0.02) activation markers in DCs performed by flow cytometry. Bar graph represents mean ± SEM, from three independent experiments (n = 3). Data were analyzed using a two-tailed unpaired t-test. (E) Bar graph showing the quantification of dead B16F10 cells after incubation with CD8+ T cells. Best of three independent experiments is shown, mean ± SEM from biological triplicates, one-tailed unpaired t-test (*p = 0.032).

