Figure 4.
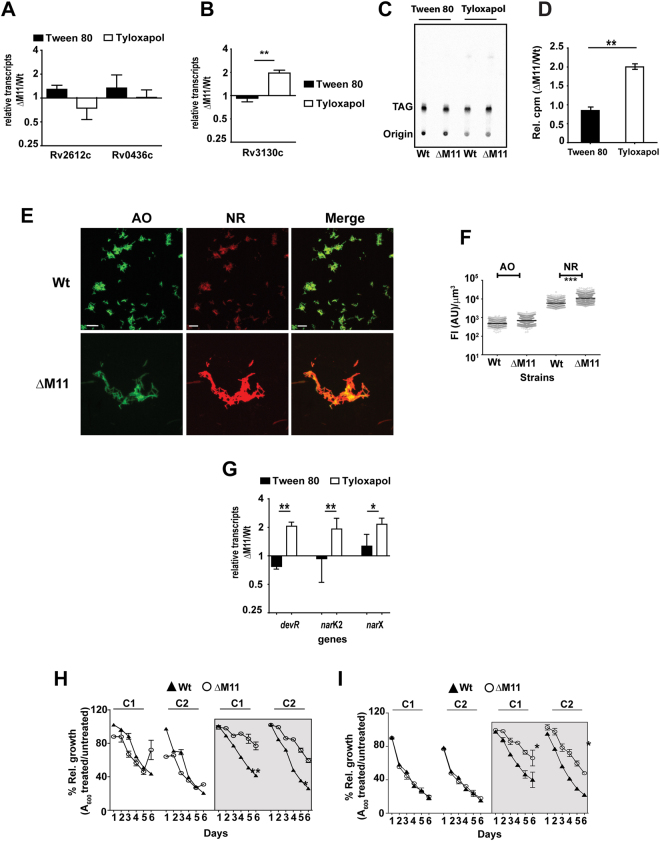
Loss of MmpL11 in Mtb leads to Tyloxapol induced neutral lipid abundance in the cell: (A,B) Analysis of expression of Mtb genes by qPCR is represented as relative transcripts ΔM11/Wt (fold change in the mutant with respect to Wt): (A) Rv2612c, Rv0436c; (B) putative triglyceride synthase tgs1- Rv3130c. (C,D) TLC and radiometric estimation of TAG in Mtb strains in 14C-oleate fed logarithmic cultures. (E) Representative images for AO and NR staining of Wt and ΔM11 cells grown in the presence of 0.05% Tyloxapol. (F) Quantitation of fluorescence intensities (FI) normalized to volume is graphically represented; median values are indicated by the black line for the different groups. (G) Analysis of expression of genes involved in the dormancy regulon by qPCR. The ratio of expression in the mutant with respect to Wt is depicted as relative transcripts ΔM11/Wt (fold change in the mutant with respect to Wt). (H,I) Growth of Mtb strains in either Tween 80 or Tyloxapol (boxed half) and in the presence of antibiotics as O.D. (A600) over 6 days of culture. Two concentrations (62.5 ng/ml-C1 and 125 ng/ml-C2) of rifampicin (H) or streptomycin (250 ng/ml-C1 and 500 ng/ml-C2) (I) were used in the study. Values are represented as ratio of mean O.D. (A600) in antibiotic relative to no treatment ± SD for one experiment of n = 2.

