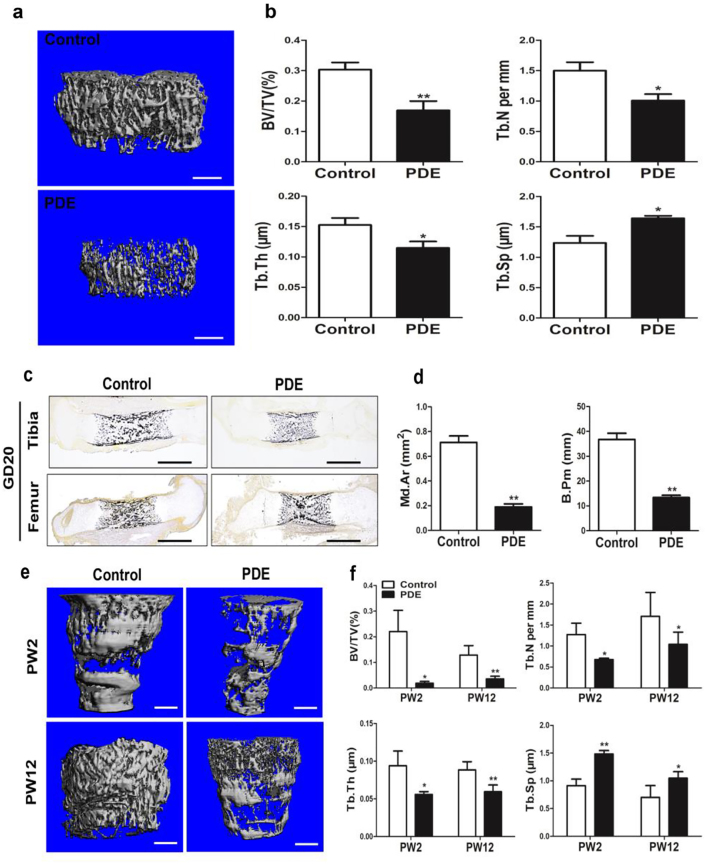
Fig. 2. Effects of prenatal dexamethasone exposure (PDE) on bone mass in F1 male offspring.
a Representative micro-CT images of femur from 28-week-old offspring with prenatal saline or dexamethasone treatment. b Quantitative micro-CT analysis of trabecular bone microarchitecture from 28-week-old offspring. c Representative von Kossa staining images of full-length tibia and femur from the control and PDE groups on gestation day (GD) 20. d Quantification of the mineralized area (Md.Ar) and bone perimeter (B.Pm) in primary ossification center. e Representative micro-CT images of femur from 2 or 12-week-old offspring with prenatal saline or dexamethasone treatment. f Quantitative micro-CT analysis of trabecular bone microarchitecture from 2 or 12-week-old offspring. Mean ± S.E.M., n = 8 per group, *P < 0.05, **P < 0.01 compared with the control. Scale bar = 500 μm. BV/TV, bone volume/trabecular volume; Tb.N, trabecular number; Tb.Th, trabecular thickness; Tb.Sp, trabecular separation

