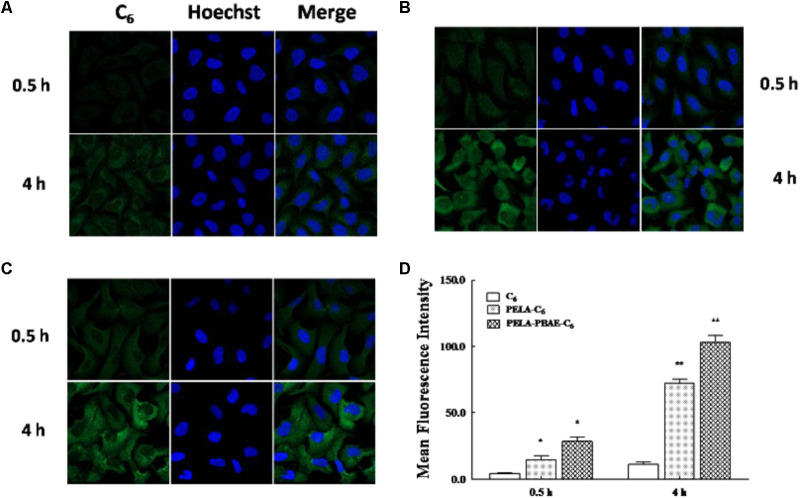
FIGURE 3.
Cell uptake of free C6 and micelles incorporated C6. Confocal FL images of cellular internalized C6 (A), PELA-C6 (B), and PELA-PBAE-C6 (C), after 0.5 and 4 h incubation with 4T1 cells. Blue FL represents Hoechst 33342, green FL represents C6. (D) Flow cytometry analysis of mean FL intensity (n = 10,000 cells) in 4T1 cells incubated with C6, PELA-C6, and PELA-PBAE-C6 for 0.5 and 4 h, respectively. Results are presented as the mean of three measurements ± SD. ∗P < 0.05, ∗∗P < 0.01.

