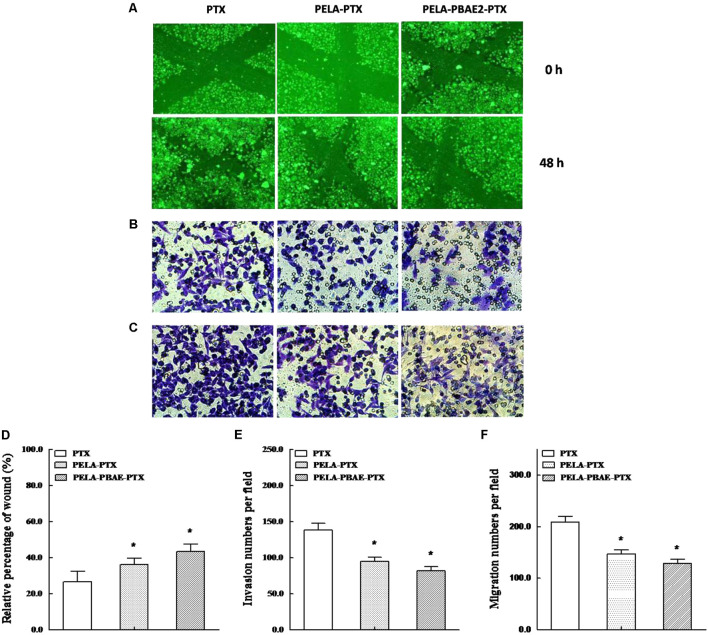
FIGURE 6.
The inhibitory effects on motility, invasion and migration of 4T1 cells. (A) Wound healing images taken after treatment by PTX, PELA-PTX and PELA-PBAE-PTX with PTX dosage of 40 nM for 0 and 48 h, respectively. Representative invasion (B) and migration (C) images of cells treated with respective PTX formulations. Quantitative analysis of the inhibitory effects on cell motility (D), invasion (E) and migration (F) after treatments with different PTX formulations for 24 h. Data were presented as mean ± SD (n = 3). ∗p < 0.05 vs. control group.

