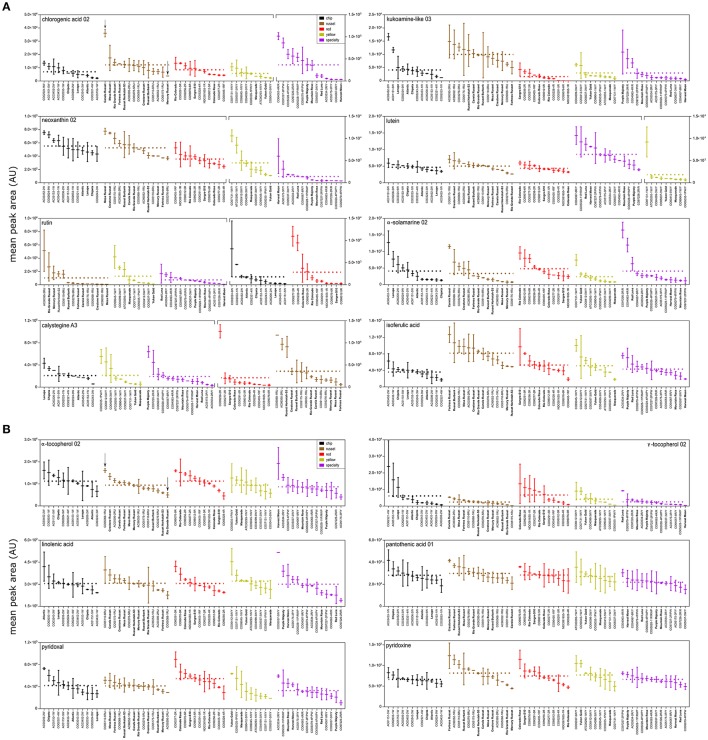
Figure 5.
Metabolite variation among and within potato market class. Box and whisker plots of (A) bioactive and (B) nutrient compounds in cooked potato demonstrate greater variation within potato market class than among potato market class. Potato genotypes within each market class (colored) are arranged from highest mean peak area (normalized abundance) to lowest mean peak area. Fold variation within a market class is calculated as mean normalized abundance of the highest potato cultivar within a potato market class divided by the mean normalized abundance a of the lowest potato variety within a potato market class. Dashed line represents mean normalized abundance for a market class. Fold variation among potato market classes is calculated as mean normalized abundance of the highest potato market class over average mean peak area of lowest potato market class. Potato genotypes in bold denote potato cultivars (released commercial varieties). Plot breaks are used to account for plotting large differences in metabolite abundances.

