
Figure 6.
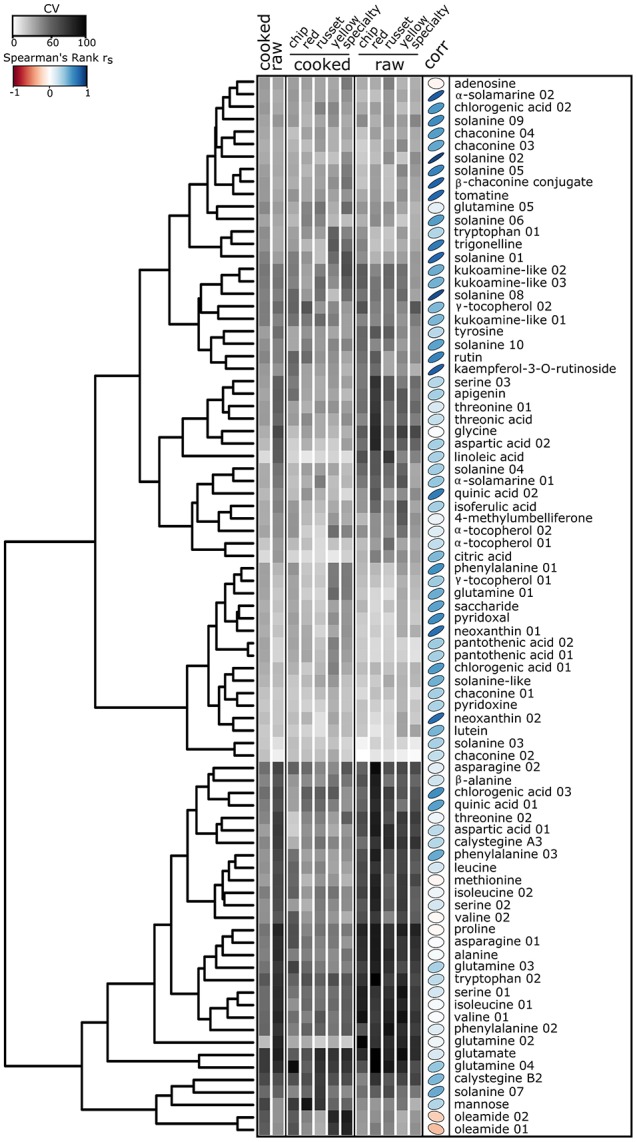
Heat map of the relative standard deviation of nutrients and bioactive compounds identified in cooked and raw potato tubers. Gray squares represent the mean coefficient of variation (CV) for each of the 85 nutrients and bioactives within raw or cooked samples (n = 120), and among market class within raw or cooked tubers. CV was calculated as: CV = σ/μ *100, where σ is the standard deviation or the metabolite for each individual cultivar within a treatment and μ is the mean abundance for the metabolite for each individual cultivar within a treatment. The CV is calculated for each individual cultivar, averaged across treatments, and represented as a heat map. Hierarchical clustering was performed using Euclidian distances. Spearman's rank correlation rs (corr) between cooked and raw metabolites color and ellipse eccentricity denote rs.