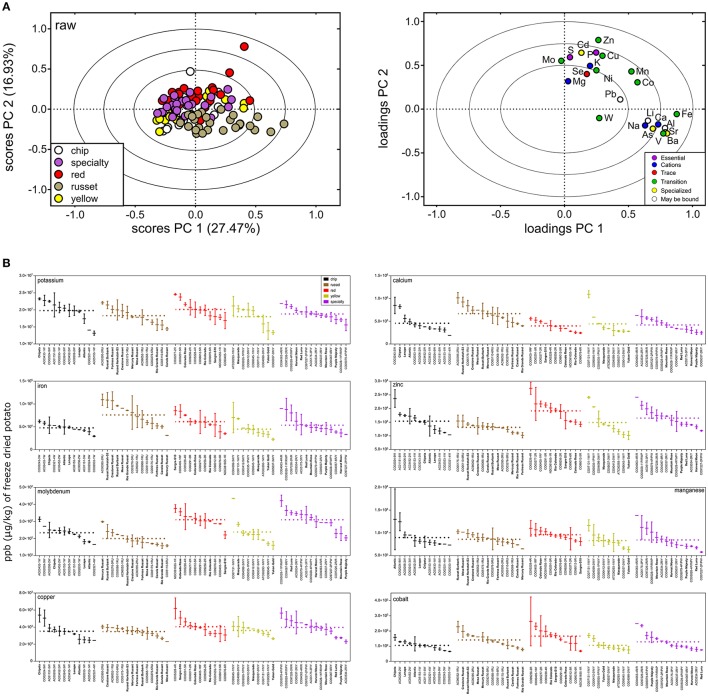
Figure 7.
Mineral variation in raw potato tuber. (A) PCA was performed on the potato ionome and colored according to potato market class (scores plot, left). PC 1 and PC 2 explained variation among market class for 23 elements (loadings plot, right). The PCA loadings and scores plot were correlation scaled and ellipses denote 0.5, 0.75, and 1.0 correlation values. (B) Box and whisker plots of micro- and macronutrient distribution highlight greater variation within potato market class than among potato market class. Potato genotypes within each market class (colored) are arranged from highest mean ppb (μg/kg) of freeze-dried potato to lowest. Mean fold variation within a market class is calculated as mean ppb (μg/kg) of freeze-dried potato of highest potato cultivar within a potato market class divided by mean ppb (μg/kg) of freeze-dried potato of lowest potato variety within a potato market class. Dashed line represents mean ppb (μg/kg) of freeze-dried potato for a market class. Mean fold variation between potato market classes is calculated as mean ppb (μg/kg) of freeze-dried potato of highest potato market class divided by mean ppb (μg/kg) of freeze-dried potato of lowest potato market class. Potato genotypes in bold denote potato cultivars (released commercial varieties). Al, aluminum; As, arsenic; Ba, barium; Cd, cadmium; Ca, calcium; Co, cobalt; Cu, copper; Fe, iron; Pb, lead; Li, lithium; Mg, magnesium; Mn, manganese; Mo, molybdenum; Ni, nickel; P, phosphorous; K, potassium; Se, selenium; Na, sodium; Sr, strontium; S, sulfur; W, tungsten; V, vanadium; and Zn, zinc.

