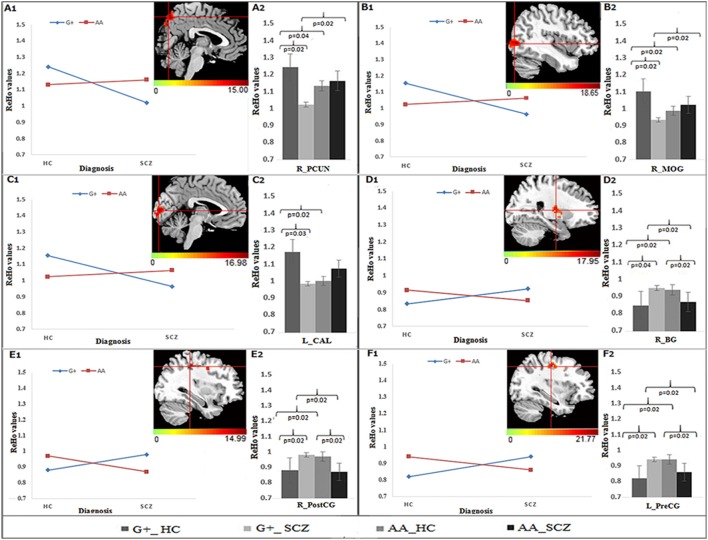
Figure 1.
The interaction and simple effect between rs821617 genotypes and diagnosis on ReHo. (A1–F1) Clusters of significance for the interaction. (A1) R-PCUN, (B1) R-MOG, (C1) L-CAL, (D1) R-BG, (E1) R-PostCG, (F1) L-PreCG. (A2–F2) Plots show the simple effect resulted from the genotype G+ vs. AA across diagnosis.

