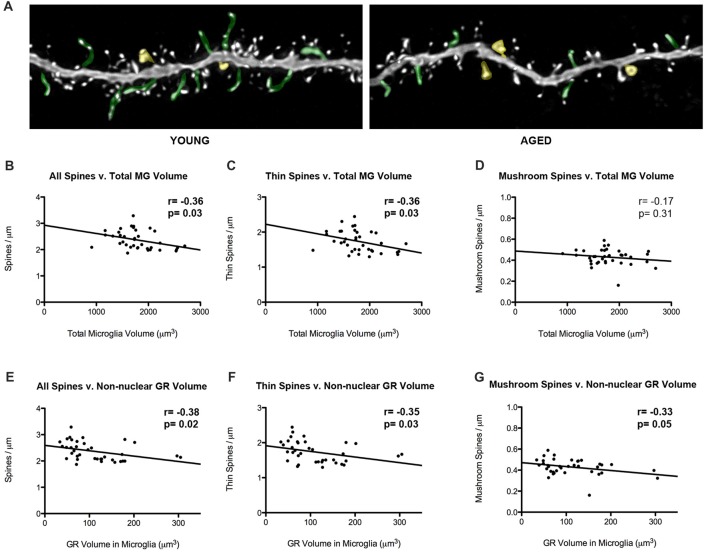
Figure 5.
Microglial volumes and expression of non-nuclear microglial GR correlate with prefrontal dendritic spine density. (A) Twenty-five micrometer by 10 μm images of spines seen on layer III PL pyramidal dendrites in old and young rat models. Examples of thin spines are highlighted in green, and examples of mushroom spines are highlighted in yellow. (B) The relationship between microglia volume and dendritic spine densities from layer III PL PFC pyramidal cells (r = –0.36, p = 0.03). (C) Relationship between thin spines and microglia volume (r = –0.36, p = 0.03). (D) Relationship between mushroom spines and microglia volume (r = –0.17, p = 0.31). (E–G) Same as (B–D), but with non-nuclear microglial GR volume (E: r = –0.38, p = 0.02; F; r = –0.35, p = 0.03; G; r = –0.33, p = 0.05). Significant r values with p < 0.05 outlined in bold.

