
FIGURE 11.
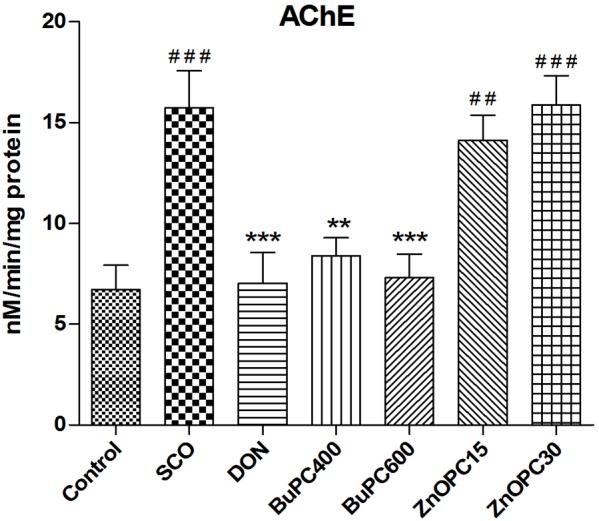
Effect of BuPC and ZnOPC on brain AChE activity. Data represented as mean ± SEM (n = 6), analyzed by one way ANOVA followed by Newman–Keuls multiple comparison test. Significant difference #p < 0.05, ##p < 0.01, ###p < 0.001 in comparison to control group. Significant difference ∗p < 0.05, ∗∗p < 0.01, ∗∗∗p < 0.001 in comparison to scopolamine treated group.