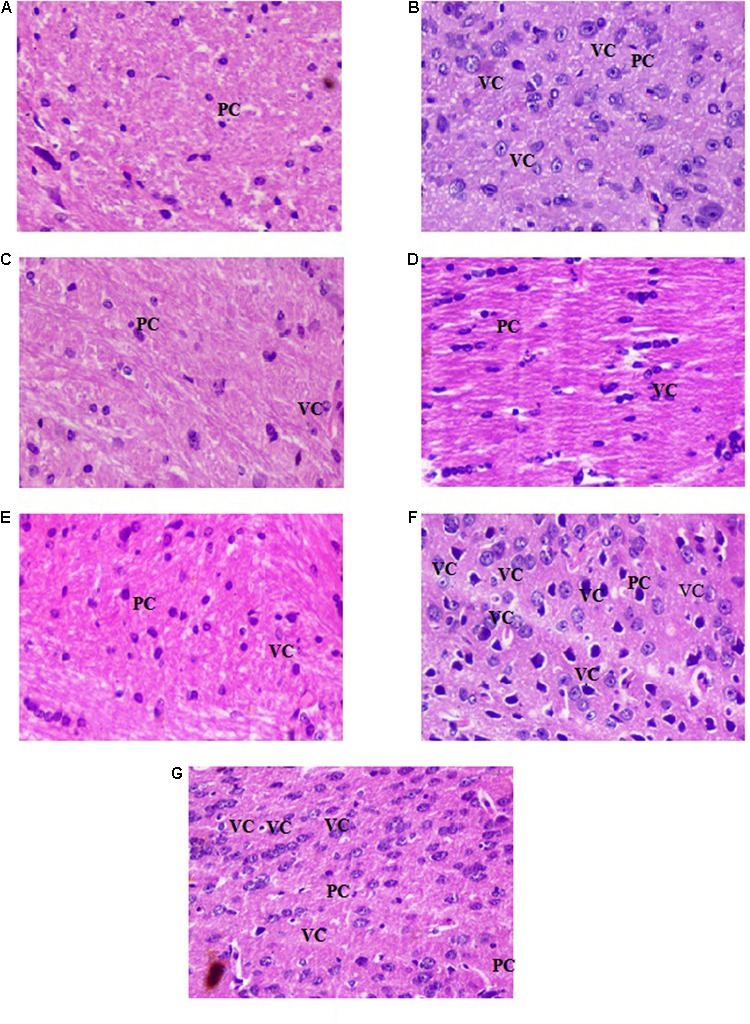
FIGURE 14.

Photomicrographs of brain tissue stained with haematoxylin-eosin dye at 20× magnification (A) control group, (B) scopolamine group, (C) donepezil group, (D) BuPC400 group, (E) BuPC600 group, (F) ZnOPC15 group, and (G) ZnOPC30 group. PC-pyramidal cells; VC-vacuolated cytoplasms (index of neurodegeneration).
