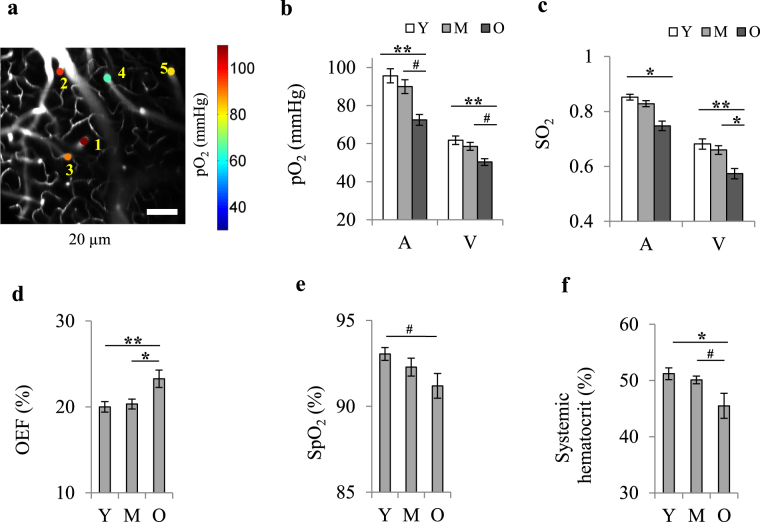
Figure 1.
Decreased cerebral vascular oxygenation with age. (a) Examples of vascular pO2 imaging in diving arterioles (1–2) and ascending venules (3–5) at the depth of ~20 µm in a young mouse. The scale bar is 100 µm. (b,c) Changes in mean arteriolar (A) and venular (V) pO2 and SO2 with age. Mean pO2 and SO2 for each vessel were obtained by averaging the values over the first 150 µm of depth. pO2 values were converted to SO2 using the Hill’s equation (for arterioles: Y, n = 21; M, n = 21; O, n = 26 vessels; for venules: Y, n = 23, M, n = 25, O, n = 31 vessels; data from 8 young, 8 middle-aged, and 8 old mice). (d) Oxygen extraction fraction (OEF) versus age, obtained from SO2 values in (c). Error bars were obtained from SO2 standard deviations using the theory of error propagation. (e) Arterial oxygen saturation (SpO2) measured by pulse oximetry on the tail (Y, n = 15, M, n = 14, O, n = 14 mice). (f) Systemic hematocrit measured on a separate batch of mice (age-matched) by centrifugation of blood samples (Y, n = 10, M, n = 9, O, n = 8 mice). Y: young, M: middle-aged, O: old. Bar plots represent mean ± s.e.m. Statistical significance was calculated using ANOVA followed by Tukey HSD post hoc test. **p < 0.01 *p < 0.05, #p-value approaches significance (p < 0.1).

