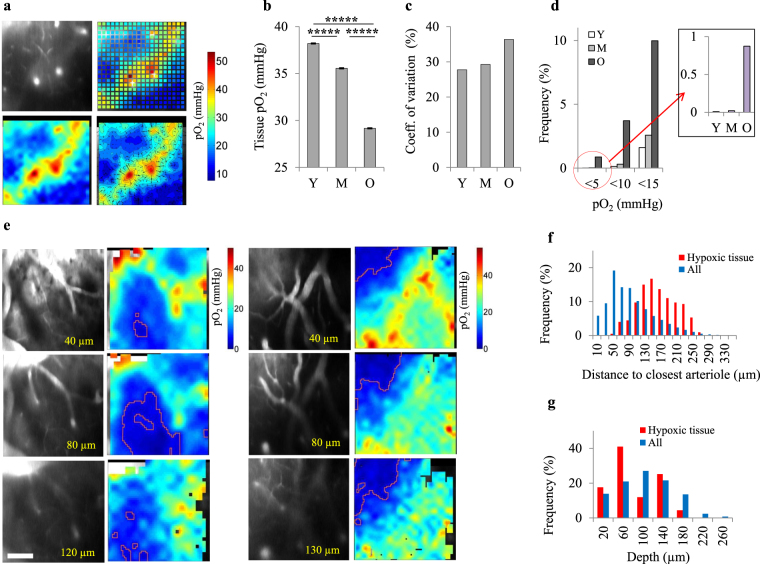
Figure 2.
Compromised cerebral tissue oxygenation in old ages. (a) A representative pO2 grid over a 400 µm × 400 µm region at the depth of 130 µm; top-left: fluorescent image showing the vasculature, top-right: pO2 grid measurements, bottom-left: interpolation of 2D grid image, bottom-right: contour plots of bottom-left image. (b) Average tissue pO2 decreased with age (Y, n = 27037 sampled points from 7 mice; M, n = 23549 sampled points from 6 mice; O, n = 25974 sampled points from 7 mice). The bars represent mean ± s.e.m. Statistical significance was calculated using ANOVA followed by Tukey HSD post hoc test. *****p < 0.00001. (c) Spatial heterogeneity of pO2 distribution in tissue (defined as coefficient of variation = SD/mean) increased with age. (d) The percentage of sampled points with low pO2 increased with age. In young (Y) and middle-aged (M) mice, percentage of hypoxic points (pO2 < 5 mmHg) is negligible, but in old (O) animals, about 1% of sampled points are hypoxic (inset figure). (e) Two examples of hypoxic micro-pockets (marked with red lines) observed in old mice. We found hypoxic tissue in 3 old mice (out of 7 imaged old mice). The scale bar is 100 µm. (f) Distribution of the distance of sampled points to closest arteriole for all points and hypoxic points (pO2 < 5 mmHg) in old group, showing a negative correlation between the chance of hypoxia and distance to closest arteriole. (g) Distribution of the depth of sampled points for all points and hypoxic points (pO2 < 5 mmHg) in old group, showing no clear correlation between the chance of hypoxia and depth. Y: young, M: middle-aged, O: old.

