Figure 3.
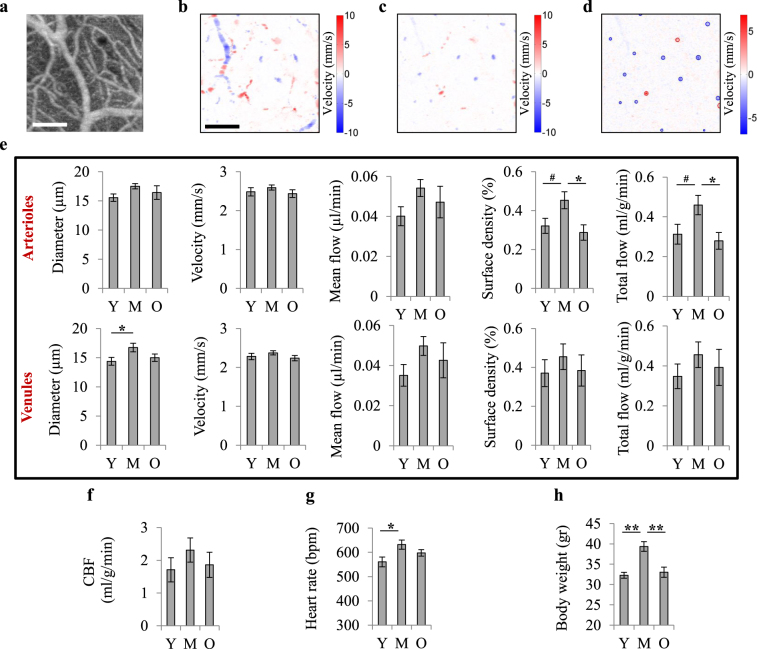
Non-capillary blood flow. (a) En face maximum intensity projection (MIP) of a 3D OCT angiogram through the depth of 0–650 µm. The scale bar is 200 µm. (b) En face MIP of a 3D OCT velocity volume through the depth of 0–650 µm, on the same region as in (a). Positive velocity represents downward flow (arterioles) and negative velocity represents upward flow (venules). The shifts in flow direction in surface vessels are due to their curved path. (c) En face MIP of a 3D OCT velocity volume through the depth of 50–100 µm, on the same region as in (a). The top 50 µm volumes were excluded to remove the surface vessels. Only 50 µm of depth just below the surface vessels was included for the estimation of total blood flowing into or out of brain in the imaged region. (d) An en face slice through the OCT velocity volume at a cortical depth of approximately 70 μm, over the same region as in (a). For each slice in the OCT velocity volume, arterioles and venules were detected (red and blue circles) and their diameter, average velocity and flow were obtained. The summation of flow and cross-section area of individual vessels over the slice yielded the total arterial or venular flow and the surface densities of vessels over the region at each depth. (e) Diameter, velocity and flow of individual vessels detected in the slices of the OCT velocity volume, as well as total arterial and venular flow and surface densities were averaged through the depth of 50–650 µm to yield the mean values over the imaged region in each animal. Top 50 μm cortical layer was excluded to remove surface vessels (top row: arterioles; bottom row: venules). (f) For each animal, arterial and venular total flows, averaged through the depth of 50–100 µm, were averaged as an estimate of regional CBF. (g) Heart rate, extracted from pulse oximetry data. (h) Body weight. Y: young (n = 14), M: middle-aged (n = 14), O: old (n = 15). Bar plots represent mean ± s.e.m. Statistical significance was calculated using ANOVA followed by Tukey HSD post hoc test. **p < 0.01, *p < 0.05, #p-value approaches significance (p < 0.1).

