FIGURE 4.
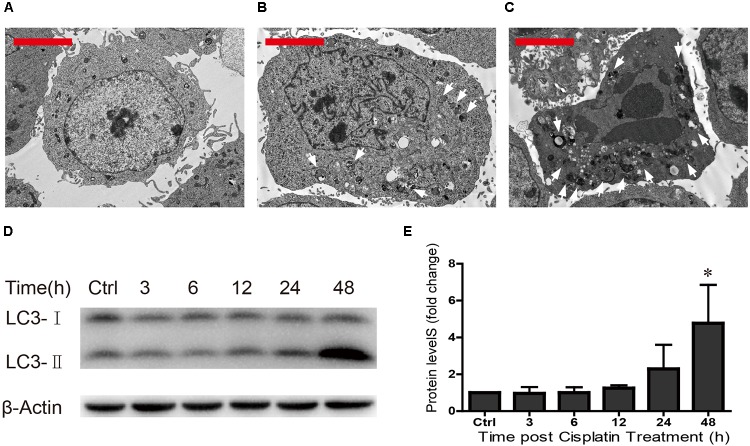
TEM was used to determine cell morphology in (A) the undamaged HEI-OC1 cells, (B) after cisplatin treatment for 24 h, and (C) after cisplatin treatment for 48 h (arrows in the pictures indicate the autophagic lysosomes). (D) Western blot results showing LC3-II expression changes after different exposure times (0, 3, 6, 12, 24, and 48 h). β-actin served as the sample loading control. (E) Quantification of the western blot in d. ∗p < 0.05 compared with the control. n = 3. Scale bars = 2 μm.

