FIGURE 13.

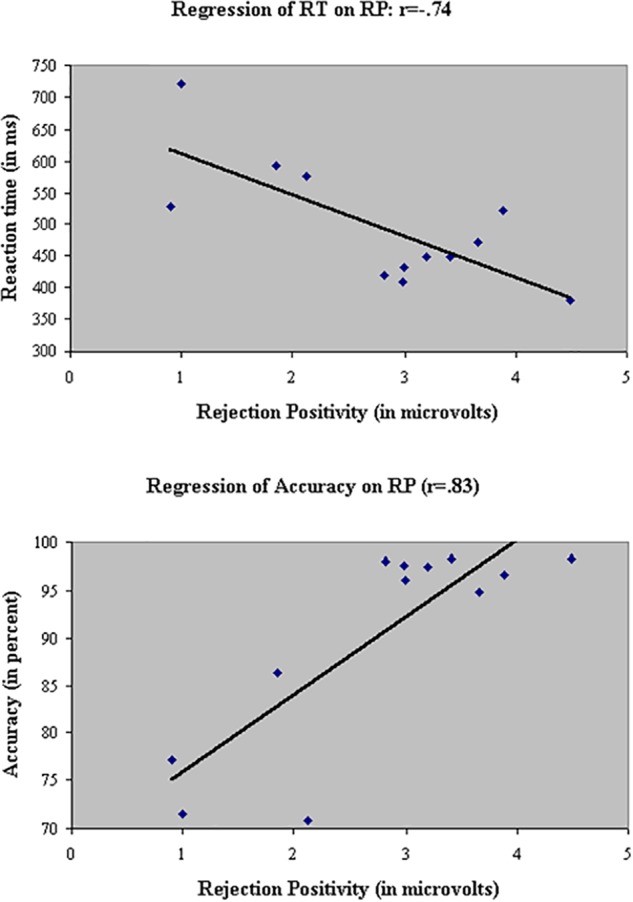
Linear regressions of the two behavioral measures, RT (Top) and accuracy (Bottom), on RP to the initial distractor. As RP increased, participants responded faster (r = –0.74) and more accurately (r = 0.83).

Linear regressions of the two behavioral measures, RT (Top) and accuracy (Bottom), on RP to the initial distractor. As RP increased, participants responded faster (r = –0.74) and more accurately (r = 0.83).