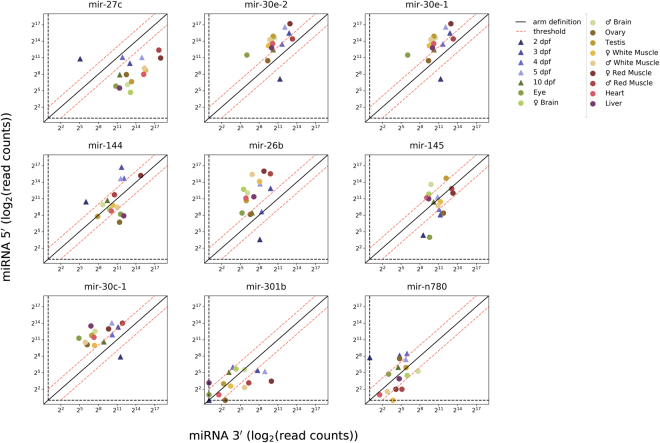
Figure 5.
Individual profiles of miRNAs showing switches in arm counts at early and adult stages. X-axis represents 3p miRNA mapped raw read counts (log2) and Y-axis represents 5p miRNA mapped raw read counts (log2). Diagonal line represents same expression rates from 5p and 3p. Data series on the right side of the line shows greater proportion of 5p over 3p, while data series on the left side of the line shows a greater proportion of 3p over 5p.Threshould (dashed red line) represents Fold change ≥2 or ≤−2.

